The search for objective analysis in the cause of making informed investment decisions is the Holy Grail of finance. Unfortunately, narrative risk continually threatens to derail us on our crucial quest for perspective. Everyone loves a good story, and it’s no different when it comes to finance and economics. The problem: there’s an excess of interesting narratives that too often are bereft of useful information. Genuine insight that’s earned by way of a clear-eyed review of the numbers, in other words, is the exception in a world that’s overflowing with story lines that appeal to emotion rather than intellect.
Unfortunately, we’re bombarded with distraction. The self-proclaimed seer on TV who spins a good yarn about what’s really driving prices or the business cycle can draw a crowd by dispensing entertaining narratives about gloom and glory. Bigger is always better from a media vantage, even if the facts don’t easily fit the narrative. Meanwhile, a sober reading of the numbers is a yawn if you’re trying to maximize eyeballs pinned to the tube. Making reasonable decisions and producing compelling media content, in short, are often at cross purposes.
What’s the solution? There are many paths to quantitative enlightenment, including the powerful analytics that arise from probit and logit regressions. There are no silver bullets here, but the ability to translate raw data into specific probability estimates for a particular condition offers a valuable resource for cutting through the noise. The flexibility and power that probit and logit models bring to the table suggest that running the numbers through these filters should be on everyone’s short list of analytical tools.
As a simple review of how these models work, let’s run through the basics using R code as the quantitative lingua franca, although you could easily do the same in Python or even Excel. But first a warning: the illustration below is a toy example and not a very useful one as presented in terms of making real-world decisions. But the general outline is valid and so the process will offer a flavor of how to deploy this modeling framework. (Here’s the R code to replicate the data discussed below.)
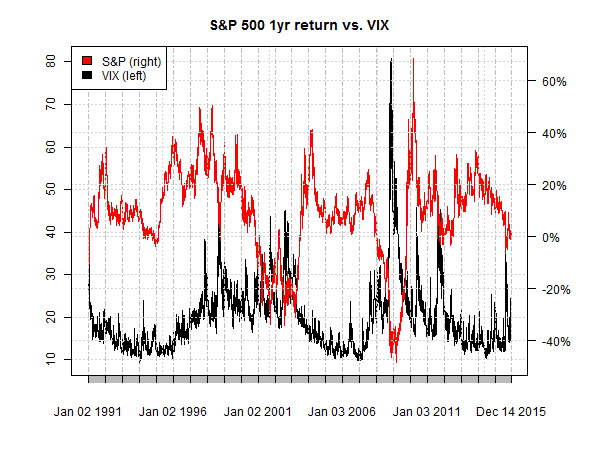
Let’s say that you think that the VIX index, which tracks the implied volatility of the US stock market (S&P 500), offers useful information for monitoring and measuring equity risk. After eyeballing a chart of the two indexes (as shown below) you decide that a VIX reading above 20 is a warning sign for the market. But how threatening is a 20-plus reading? One way to quantify the danger is by analyzing the S&P 500 in context with the VIX by way of a probit model.
The first step is creating a data set of binary signals that reflect your definition of “risk.” The sky’s the limit for customizing this definition, but in the interests of keeping this short review from becoming a consulting project let’s use one simple metric: rolling one-year return for the S&P 500. The research agenda is estimating the probability of a negative one-year return based on the current VIX reading. (Yes, this is a bit naïve not to mention superfluous, but it’s good enough to profile probit modeling.)
With our research map in hand, it’s a simple matter of getting the data in shape. The first step is creating a set of binary signals to indicate the state of the market that we’re trying to model. Remember, a probit model is designed to estimate probabilities for one of two states, which is considerably easier and therefore more practical in the real world vs. trying to model a spectrum of conditions. In keeping with our simplistic example. any negative one-year return for the S&P is labeled as “1” and a positive return as “0”.
The next step is instructing the probit model to estimate the probability that the S&P is in negative territory by way of analyzing the historical relationship between the VIX and the signal data as defined above. Right about now you’re probably complaining that we already know the state of S&P one-year return by looking at real-time market data without referring to the VIX. Agreed, and so creating a probit model to tell us what’s already obvious is a redundant exercise. True, at least in this case, but the point of all this is to outline a basic probit procedure. Keep in mind that a genuine effort in this corner would probably focus on modeling a state that’s unclear in real time, such as the start of a recession or some other aspect of market risk that’s not readily available.
As for our toy example with the S&P, here’s the result of the probit model estimates for the probability that the S&P’s trailing return is below zero.
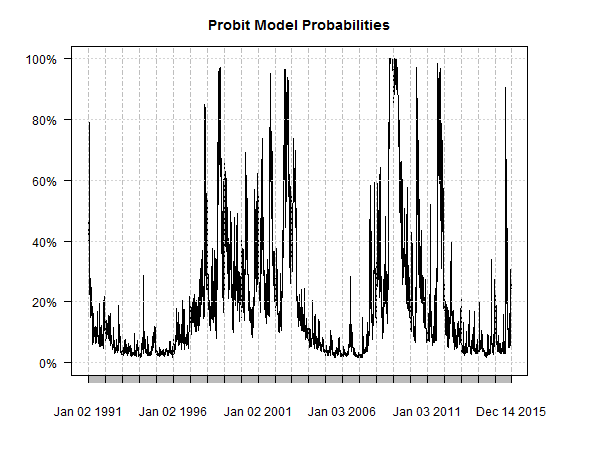
Visual inspection suggests there’s some meat on this bone. The rising probability that eventually reached 100% in late-2008, for instance, tells us that there’s a relatively robust relationship between the S&P and the VIX. Well, of course there is! We already knew that. The probit model is simply quantifying the relationship per our specifications.
The question is how or if such a model should be adjusted. Is modeling trailing 6-month return preferable to 1-year performance? Should we raise or lower the 20-plus VIX trigger? What about adding in additional variables—the 10-year Treasury yield, for instance.
There’s a wide array of possibilities here, which is a benefit and a curse. A benefit because probit modeling (and its close cousin logit modeling) can be customized in an endless variety to extract estimates of a particular state from raw data. But that’s a curse if you’re unsure of how to proceed. In other words, doing preliminary research to map out a reasonable strategy is essential before you dive into the numbers.
But with a bit of advance planning, deploying a probit model can offer deep insight into market and macro analysis. There are no guarantees, of course—probit models can lead us astray in some cases, particularly when we’re sloppy with assumptions about relevant variables. But compared with listening to someone’s interpretations of what the latest market moves suggest, probit modeling offers objective context without the baggage of behavioral biases. It’s not a complete solution to narrative risk, but it’s a good start.
Pingback: Quantocracy's Daily Wrap for 12/15/2015 | Quantocracy