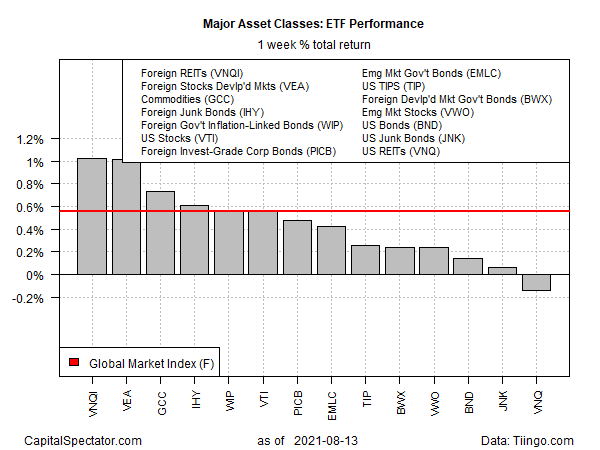
International real estate stocks ex-US, followed by foreign developed-market companies, topped returns for the major asset classes for the trading week through Friday, Aug. 13, based on a set of ETFs.
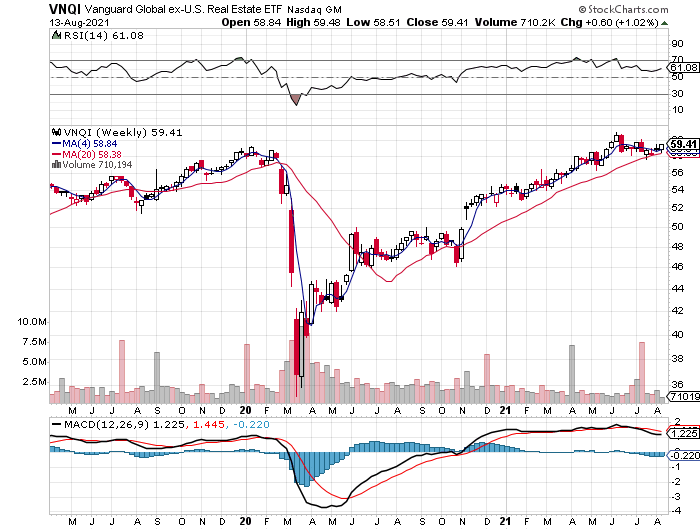
The recent rally for Vanguard Global ex-US Real Estate Index (VNQI) has stalled in the summer, but the fund popped 1.0% last week. That’s the third weekly gain in the past four, possibly signaling that the ETF is poised for an upside break out of its trading range.
Meanwhile, stocks in developed markets ex-US continue to post relatively strong results. Vanguard FTSE Developed Markets (VEA) was last week’s second-best performer, trailing VNQI by the smallest of margins. In contrast with VNQI, however, VEA’s upside trend has been stronger and more persistent. At Friday’s close, VEA was just pennies below a record close.

The only weekly loser for the major asset classes last week: US real estate investment trusts (REITs). Vanguard US Real Estate (VNQ) slipped 0.1%. The setback marks the first weekly decline in the past six. Given the persistent upside trend, however, the decline looks like noise for this ETF, which has been setting record highs through the summer.
A benchmark portfolio that holds all the major asset classes posted a second weekly gain. The Global Market Index (GMI.F) rose 0.6% last week. This unmanaged benchmark (maintained by CapitalSpectator.com) holds all the major asset classes (except cash) in market-value weights via ETF proxies.
For the one-year window, US stocks continue to lead, just barely. Vanguard Total US Stock Market (VTI) is up a sizzling 36.5% on a total-return basis over the past 12 months. That’s slightly ahead of the second-best one-year performer: Vanguard US Real Estate (VNQ), which is up 36.4% over the past year.
The only one-year loser at the moment for the major asset classes: US investment-grade bonds (BND). The ETF is off a slightly 0.2% for the trailing 12-month window.
GMI.F’s one-year gain is a strong 24.1%.

In a sign of the times, most of the proxy ETFs currently reflect peak-to-trough declines no deeper than -5%. US stocks (VTI) remain the current leader for drawdown with a 0% peak-to-trough decline as of Friday’s close. Meanwhile, commodities (GCC) are still posting the deepest drawdown by: a bit more than -30%.
GMI.F’s current drawdown is zero, courtesy of ending last week at a record high.

Learn To Use R For Portfolio Analysis
Quantitative Investment Portfolio Analytics In R:
An Introduction To R For Modeling Portfolio Risk and Return
By James Picerno