Today marks the first press conference for the new Fed Chair Janet Yellen. Although she faces a complicated set of decisions for monetary policy in the months and years ahead, she still has one advantage that supported her predecessor’s tenure in recent years: a moderately positive macro trend.
Granted, the economic news has been mixed lately for the US. But the case for growth overall in the near term is still compelling when we look across a spectrum of indicators. Nonetheless, the macro bears have been howling lately, warning that the cycle has taken a dark and irreversible turn for the worse. That may yet prove true, but at the moment there’s minimal evidence for that scenario, based on today’s update of a diversified set of 14 economic and financial data sets.
The February profile of the US Economic Trend and Momentum indices (ETI and EMI, respectively) remain at levels that equate with expansion and the estimates for the next several months suggest that growth will roll on for the near term. This upbeat outlook may change, of course, depending on how the March numbers stack up. Meantime, the nearly complete February profile tells us that recession risk is a low-probability event, based on what we know today.
There are some weak spots, however. In particular, the sharp deceleration of late for hours worked could be an early sign of trouble. Ditto for the slowdown in real retail sales on an annual basis. But when we look at the broad picture for February, positive momentum is still the dominant force, as you can see in the table below.

For another perspective, consider the composite measure of the 14 indicators in the table above via ETI and EMI (see chart below for definitions). Both of these business cycle metrics remain well above their respective danger zones: 50% for ETI and 0% for EMI. If and when these indexes fall below those tipping points, we’ll have clear warnings signs that recession risk is elevated. For now, there’s still a comfortable margin between current values (92.5% for ETI and 6.8% for EMI) and the danger zones.

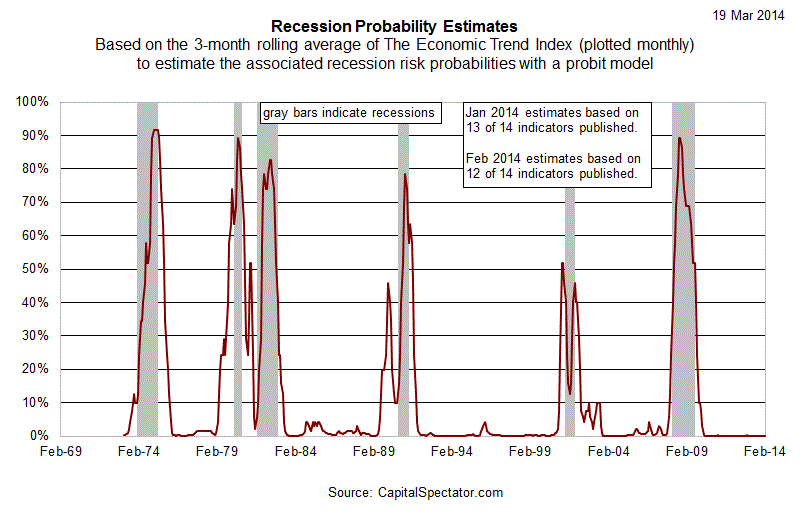
Translating ETI’s historical values into recession-risk probabilities via a probit model also suggests that business cycle risk is low.
For some perspective on how ETI’s values may evolve as new data is published in the near future, let’s review projections for this index with an econometric technique known as an autoregressive integrated moving average (ARIMA) model, based on calculations via the “forecast” package for R, a statistical software environment. The ARIMA model estimates the missing data points for each indicator, for each month through April 2014. (December 2013 is currently the latest month with a complete set of published data). Based on today’s projections, ETI is expected to remain well above its danger zone in the near term.
Forecasts are always suspect, of course, but recent projections of ETI for the near-term future term have proven to be relatively reliable guesstimates vs. the full set of monthly reported numbers that followed. (That’s not surprising, given the broadly diversified nature of ETI. Predicting individual components, by contrast, is prone to far more uncertainty in the short run.) As such, the latest projections (the four green bars on the right in the chart below) offer support for cautious optimism. For comparison, the chart below also includes the vintage ARIMA projections published on these pages in previous months, which you can compare with the complete monthly sets of actual data that followed, based on current numbers (red circles). The assumption here is that while any one forecast for a given indicator is likely to be wrong, the errors may cancel one another out to some degree by aggregating a broad set of predictions into ETI.

For additional context for judging the value of the forecasts, here are previously published ETI and EMI updates for the last three months:
21 Feb 2014
20 Jan 2014
19 Dec 2013
Update: The Recession Probability Estimates chart in an earlier version of this story cut off the last 12 months of data. Also, the inset box in this graph mistakenly identified Jan 2014 as Jan 2013. A corrected version of the chart has been posted. Sorry for any confusion.
Would you please post the current ETI percentage?
Thanks in advance.
Andrew, it’s already in the copy. See the final sentence in the paragraph just after the data table:
“… For now, there’s still a comfortable margin between current values (92.5% for ETI and 6.8% for EMI) and the danger zones.”
My apologies, I missed that. Thank you.
Not a problem. Thanks for reading!
Pingback: A New Book About The Business Cycle » The Capital Spectator
Pingback: Macro-Markets Risk Index: 9.4% | Prompto Capital