The coronavirus blowback and the crowd’s ongoing preference for high-flying growth investments aren’t doing any favors for value investing strategies. Perhaps the chaos of 2020 is laying the groundwork for a performance revival in assets (and asset classes) that have suffered the most. The lagging results of value generally in recent years suggest otherwise, at least by some accounts. But if there’s opportunity in beaten-down assets, at least we know where to look.
Actually, let’s not be too hard on the value concept. When we last checked in on our deep-value ETF ranking on May 21, 2020, stocks in emerging markets were close to the worst performer based on slicing and dicing via the major asset classes. Three months later, an ETF proxy for these shares — Vanguard FTSE Emerging Markets (VWO) — has outperformed US (VTI) and equities in foreign developed markets (VEA) by a modest degree. Three months is hardly a convincing test, but optimists in this corner may decide that’s it’s a fresh clue for thinking that there’s still life left in the value risk factor.
The definition of “deep value” in this column is determined by the trailing 5-year return, which is based on an idea that was outlined in a paper by AQR Capital Management’s Cliff Asness and two co-authors: “Value and Momentum Everywhere,” published in a 2013 issue of the Journal of Finance. There are many ways to measure value and so no one should confuse 5-year-performance as the last word on identifying bargain-priced assets. But as a starting point in the process of surveying the crowd’s darkest expectations for assets, the 5-year change is useful.
Learn To Use R For Portfolio Analysis
Quantitative Investment Portfolio Analytics In R:
An Introduction To R For Modeling Portfolio Risk and Return
By James Picerno
A key advantage of a 5-year performance measure: It can be applied over a broad set of assets, thereby creating a level playing field for estimating value (or the lack thereof). Another plus: this metric is simple and therefore immune to estimation risk, which can complicate accounting-based value gauges, such as price-to-book and price-to-earnings measures. In sum, the 5-year return is a handy tool as a first approximation for identifying ETFs that appear to be deeply discounted, which in turn may indicate relatively high expected returns via the value proposition.
But let’s be clear-eyed about the idea. There are no guarantees that value, no matter the definition, will lead to superior performance anytime soon, if ever. Recent history offers limited support for thinking that value will live up to its impressive long-term history. But there’s no harm in looking.
The ranking below covers 135 exchange-traded products that run the gamut: US and foreign stocks, bonds, real estate, commodities and currencies. You can find the full list here, sorted in ascending order by annualized 5-year return — 1260 trading days — through yesterday’s close (August 19, 2020).
Keep in mind that the list is quite granular. In equities, for instance, the ETFs range from broad regional definitions (Asia, Latin America, etc,) to country funds, down to US sectors (energy, financials, for instance) and industries (e.g., oil & gas equipment & services). The only limitation is what’s available for US exchange-listed funds. Note, too, that just one representative ETF for each market niche is selected, albeit subjectively. For instance, there’s only one fund on the list for US real estate investment trusts. Otherwise, the search is broad and deep, as allowed by the current availability of US-listed ETFs.
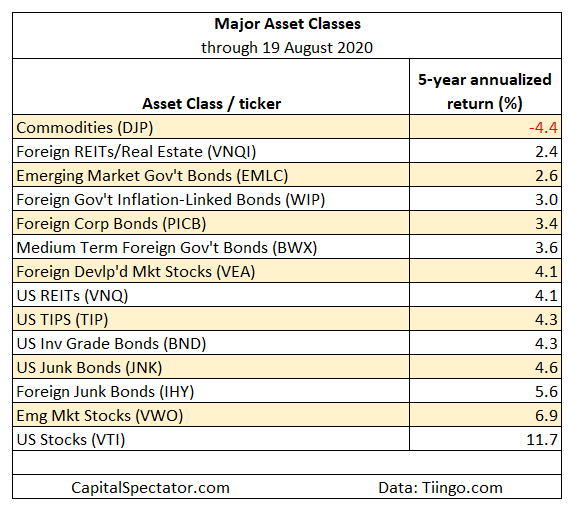
Let’s begin by ranking the major asset classes. As in the past updates, a broad definition of commodities posts the deepest shade of red for 5-year results. The iPath Bloomberg Commodity (DJP) – an exchange-trade note – has lost an annualized 4.4%. Foreign real estate shares, along with emerging-markets bonds, are also posting sub-zero returns. The implication: the long-run return for these assets is relatively high vs. the strongest performers over the trailing five years.
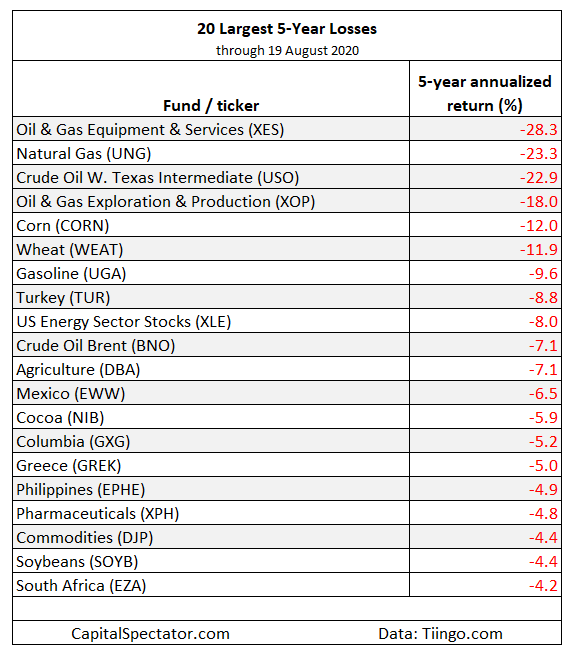
Finally, let’s turn to the deepest 20 losses for all 135 ETFs. The biggest decline: SPDR Oil & Gas Equipment & Services (XES), which has lost 28.3% a year for the past five years. Note that this was the biggest loser when we ranked funds three months ago and was second to last in January. The fund’s weak results are a reminder that deeply discounted assets can stay deeply discounted for long periods.
How is recession risk evolving? Monitor the outlook with a subscription to:
The US Business Cycle Risk Report
Pingback: 5 year returns... The Capital Spectator - Commodity Research Group
Pingback: Value's Value | 1 September 2020 - Portformer | Portfolios. Made Better.