Investor sentiment is a slippery beast, but a valuable one – if you can find reliable data. Knowing that the crowd is in a state of irrational exuberance, or hopeless despair, is especially useful. Nothing strengthens confidence like market extremes when it comes to estimating expected return and risk. But there’s that data issue to consider.
Sentiment polling is the standard approach. There’s worthwhile insight here, or at least there can be at times. But there’s also a distinct set of pros and cons. On the latter, the numbers may not be timely or precise. That doesn’t mean you should ignore conventional sentiment numbers, but there’s no reason not to supplement that data with other methodologies.
One possibility is using a ratio of moving averages as a proxy for sentiment. As a quick test, let’s compare the 50-day moving average to 200-day average as a rough approximation of animal spirits. We’ll use a set of ETFs to represent the major asset classes.
Learn To Use R For Portfolio Analysis
Quantitative Investment Portfolio Analytics In R:
An Introduction To R For Modeling Portfolio Risk and Return
By James Picerno
The assumption here is that the degree of divergence in the 50-day vs. 200-day average offers an approximation of bullish vs. bearish sentiment. Most of the time the readings will be relatively middling. When they’re not, there’s potentially valuable information to consider.
As a simple test, the chart below compares this definition of sentiment for three equity market buckets: US stocks (VTI), foreign stocks in developed markets (VEA) and shares in emerging markets (VWO). The main takeaway, sentiment is unusually bullish at the moment, at least relative to market history since 2013.

For example, Vanguard FTSE Emerging Markets (VWO) has the highest reading: 1.15, which means that that VWO’s 50-day average is about 15% above its 200-day average. Note, too, that sentiment between the three equity funds tends to be highly correlated, which suggests that there may be relatively compelling opportunities when the ratios diverge.
For another spin, the next chart compares sentiment for US stocks (VTI), US bonds (BND) and US real estate investment trusts (VNQ). In this case, the sentiment variations exhibits far more independence, as you would expect in different asset classes.
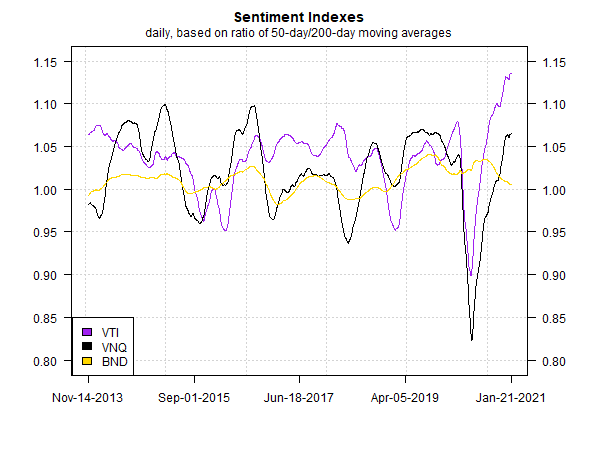
Here’s a current profile of all the ETF proxies for the major asset classes:
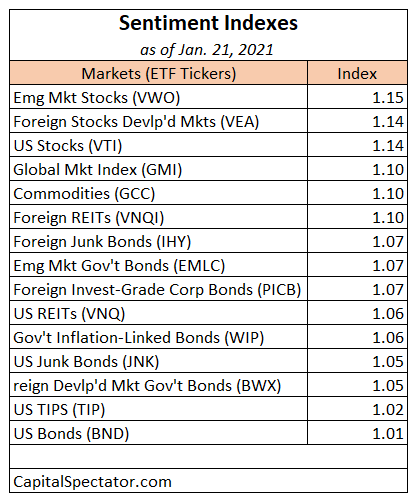
The current reading imply that every corner of global markets is exhibiting some degree of bullish sentiment, as indicated by readings above 1.0.
Quantifying sentiment by way of moving averages (or other technical indicators) has flaws, of course. But the flaws are different vs. the limitations with traditional polling methods of measuring sentiment. The difference suggests the two approaches can be complimentary and perhaps stronger and more reliable than either one on its own.
Overall, there are compelling reasons to consider quantitative approaches. As with estimating the value factor (see here, for instance), market-based sentiment readings are available in real time and reflect real-world conditions based on asset deployment. Sentiment that’s based on investment flows is a tough act to beat.
Another plus: defining sentiment with market data allows for a high degree of customization, depending on investment horizon, risk tolerance and other factors.
Perhaps the most valuable aspect of quantitative sentiment estimation is the ability to see, in real time, when the crowd’s sentiment emotional profile is at extremes. On that front, the profile above for stocks suggests that equities around the world are priced for perfection. Unfortunately, we (still) live in a very imperfect world.
How is recession risk evolving? Monitor the outlook with a subscription to:
The US Business Cycle Risk Report
Hi, thank you for sharing this creative outlook towards sentiment. What is the tool you use to come up with the 50d/200d divergences/ratios? I do have the charts of the moving averages. But is there a specific tool/indicator to calculate the ratios you talk about?
Fierce,
I use R, but you can easily generate moving averages (or its various flavors) in Python and other software/computer languages. Even easier: go to tradingview.com or stockcharts.com.
–JP