The warning signs continue to mount. Yet the US economy continues to defy expectations in some quarters that a recession is near. Granted, it’s arguably a precarious expansion that’s vulnerable on several fronts. But for the moment, in the face of seemingly overwhelming odds, a positive macro trend endures and that looks set to continue.
A broad review of business-cycle indicators suggests that recession risk remains low for the immediate future, which is to say the next one to three months. There’s no guarantee, of course – there never is with economic forecasting. But looking ahead into the very near term is relatively reliable when it’s based on drawing on the latest trend behavior from a range of indicators. All the more so when they’re telling a similar story.
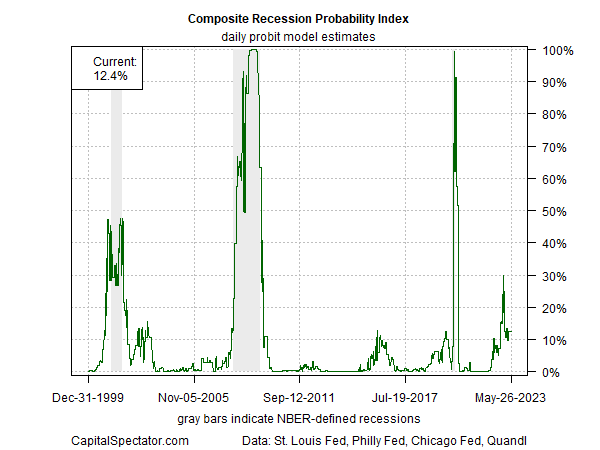
For example, aggregating several business-cycle benchmarks and running the numbers through a probit model continues to indicate a low probability that an NBER-defined recession has started. The Composite Recession Probability Index (CRPI), featured in the weekly updates of The US Business Cycle Risk Report, continues to estimate the probability of contraction at under 20%.
Focusing on a pair of real-time business cycle indexes published by two regional Federal Reserve banks highlights the short-term ebb and flow of the economy’s directional bias. The news on this front is also encouraging for the immediate future. The US Macro Trend Index (MTI) analyzes the New York Fed’s Weekly Economic Index and the Philly Fed’s ADS Index for a near-term read on the economy’s strength or weakness in the very recent past. On this score, MTI indicates that fluctuations in economic activity remain “normal,” albeit at weaker level following a surge in strength.

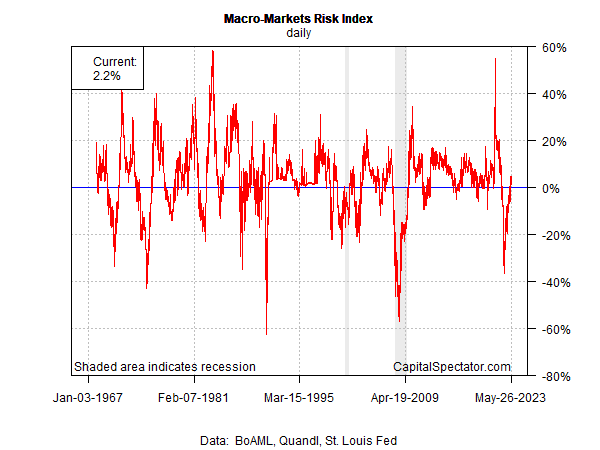
Another way to approximate real-time economic activity is by looking to markets to assess the degree of strength and weakness. The Macro-Markets Risk Index (MMRI), also featured in the weekly updates of The US Business Cycle Risk Report, combines four key market signals – US stocks, high-yield credit spread, crude oil prices and the 10-year/3-month Treasury yield spread – to estimate real-time economic conditions. On this front the numbers show a strong rebound from the recent decline, which suggests that economic activity has strengthened, albeit off of a very weak base.
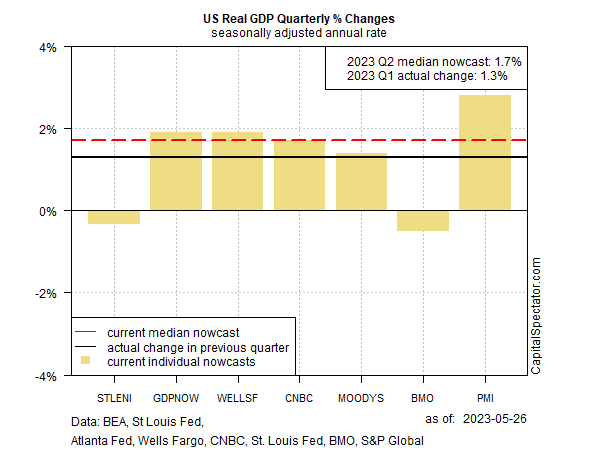
For a more fundamental measure of how the economy appears to be faring in real time we can look to the latest estimates of GDP in the current quarter. Here, too, there’s reason for cautious optimism. The median second-quarter estimate for seven nowcasts points to a modestly stronger rise in economic output vs. Q1’s gain.
Each of these economic indicators has a unique set of pros and cons and all are fallible, but it’s clear that the common theme is that recession risk appears to be low. That could change, of course, and perhaps quickly. This Friday’s payrolls report for May (due on June 2) is a possible trigger for reassessing recession risk. Economists are looking for a slowdown in hiring. The consensus forecast for a 180,000 gain in nonfarm payrolls suggests a gradual downshift in the labor market that implies recession risk will remain relatively low for the immediate future.
What could change the calculus for the worse? A renewed forecast for another round of raising interest rates at the upcoming Fed meeting on June 14 is on the short list. There’s also the uncertainty with the debt-ceiling deal that’s still winding through Congress. A big downside miss for Friday’s payrolls data could also be a game-changer for expectations.
In the here and now, however, the best guess still favors low recession risk. As always, the focus is how and if the incoming numbers and news headlines change the outlook.
How is recession risk evolving? Monitor the outlook with a subscription to:
The US Business Cycle Risk Report
Hi James,
If recession risk is low, how do we square that real gross domestic income (GDI) has been negative for two consecutive quarters now? From a historical perspective, since WWII, this has never occurred without real GDP following the same path soon thereafter.
Thanks for sharing all your great work and insights.
Jim,
That’s a good point and so real GDI’s decline in the past 2 quarters may prove to be the signal that proves the other indicators wrong. That said, real GDP & real GDP tend to track each other closely through time. There are exceptions, and relatively quickly one or the other corrects. Eyeballing history suggests it’s usually real GDI that gets it wrong, i.e., it has a tendency to be too volatile. Maybe it’s different this time, but it’s hard to know in real time. That said, from my view the preponderance of indicators still skews positive and so for the moment growth prevails. How long that lasts is open for debate.
–JP