Inflation is easing, or so recent data show. The debate is centered on how fast and how far pricing pressure will slide — or if the recent easing is a head fake. In other words, it’s the perfect time to launch a resource that summarizes and updates several of the key inflation indicators that deserve close attention on a monthly basis: The US Inflation Trend Chartbook.
This report will be published shortly after each monthly release of US consumer price indexes. Subscribers to The US Business Cycle Risk Report will automatically receive The US Inflation Trend Chartbook going forward at no extra charge. The inaugural edition can be found here.
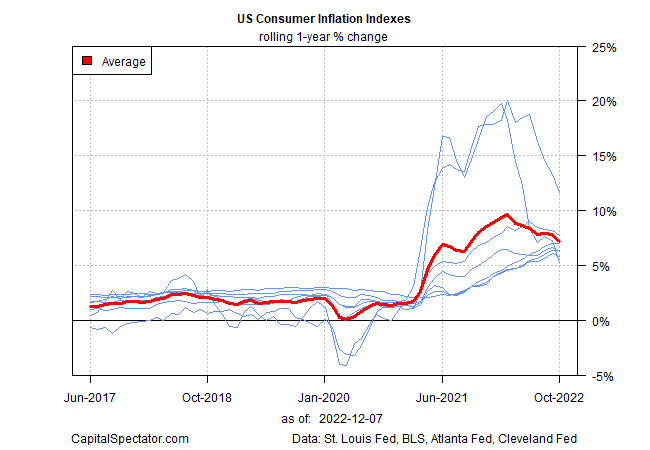
As a preview, here’s a selection of charts from the current report. First up is comparison of variations on the standard headline consumer price index (CPI). Looking at the trends on a rolling one-year basis through October clearly shows that pricing pressure has peaked, although the level of inflation remains elevated vs. the pre-surge period.
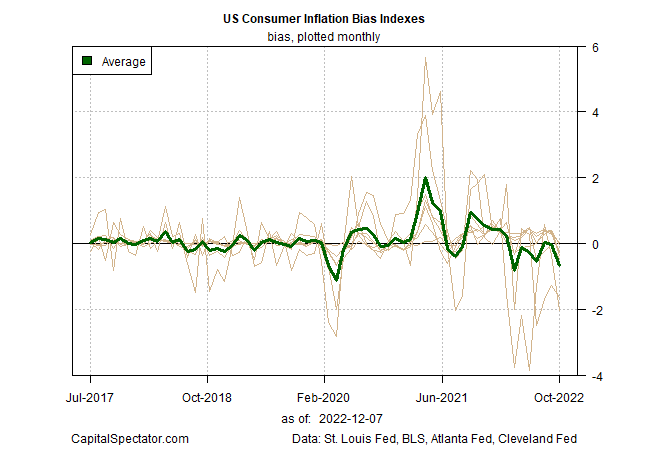
The next chart shows the “bias” of the one-year changes in the chart above. Here, too, there’s a clear indication that the trend has turned lower in recent months. The average for the US Consumer Inflation Bias Indexes was negative for a second month in October. Since May, this measure of bias has been sub-zero for all but one month, a trend that suggests inflationary pressure will continue to ease.
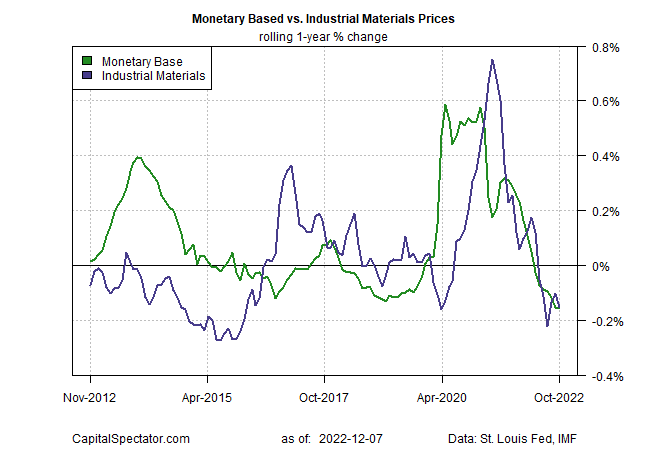
A number of other indicators also show a clear break in the recent inflation surge. For example, the one-year changes in the US monetary base and industrial materials prices have been posting negative one-results recently.
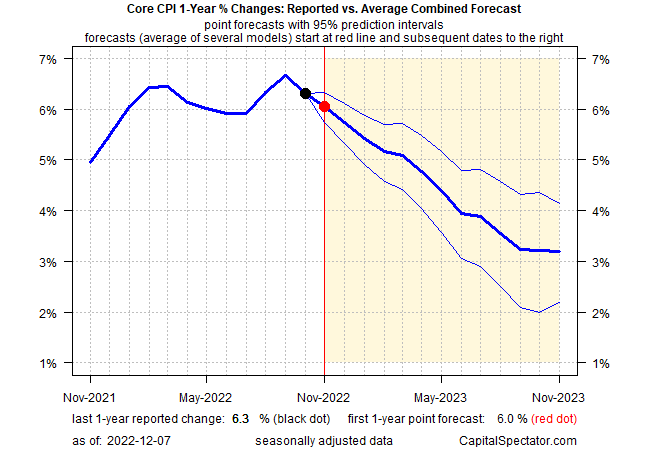
Finally, here’s the current forecast for core CPI, based on CapitalSpectator.com’s ensemble modeling.
Please refer to The US Inflation Trend Chartbook to see the full list of charts.
How is recession risk evolving? Monitor the outlook with a subscription to:
The US Business Cycle Risk Report