This year’s rebound in asset prices around the world suggests that investor sentiment is shifting to risk-on after a year of playing defense. Trying to divine the future for pricing is always precarious, especially in the near term. But there’s no charge for looking at proxies of key market trends through various ETF pairs. As we’ll see, certain slices of markets are predicting a new bull run, but it’s still early to ring the all-clear signal, according to a broad measure of US stocks relative to US bonds, which is arguably a more reliable indicator. But let’s start with the sizzle.
The poster boy for the recent change in risk appetite is captured by the recent spike in the ratio between high beta US stocks (SPHB) and their counterpart via low-volatility shares (SPLV). The key question: Will this gauge of sentiment hold on to its latest gain and maintain an upside bias?

Another way to gauge the appetite for risk sentiment is by tracking how discretionary consumer stocks (XLY) perform relative to their more defensive counterparts via consumer staples (XLP). Here too a sentiment change is visible, but the shift is weaker compared with high beta/low vol.

By contrast, a proxy for the housing outlook looks red hot, based on homebuilder stocks (XHB) relative to the US Treasuries (IEF). It’s debatable if this slice of the market is getting ahead of itself, but to the extent this is a leading indicator for economic activity it’s screaming that it’s off to the races once more.

Another proxy for the business cycle and demand for risk assets is the ratio between semiconductor stocks (SMH) and the broad equities market (SPY). The assumption here is that semis are highly sensitive to the business cycle and therefore offer early signals for major turning points in economic activity. On that basis, there’s a clear change underway.

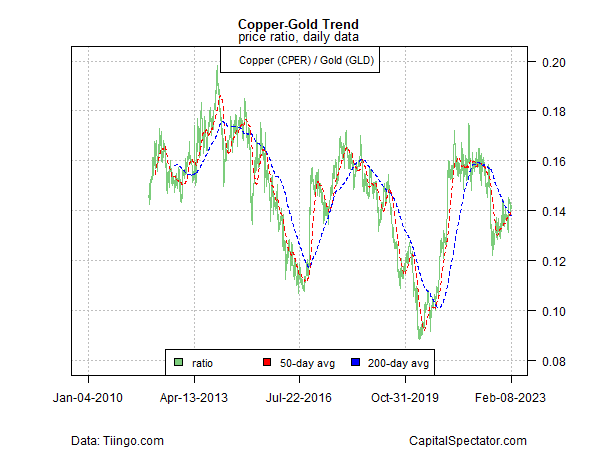
Turning to commodities, the ratio of copper (CPER) to gold (GLD) prices indicates a modest improvement in risk appetite but far more cautiously than the indicators via equities shown above. The idea here is that copper demand tends to rise and fall with economic activity vs. gold’s traditional role as a have in times of turmoil.
Finally, consider broad measures of US stocks (SPY) vs. US bonds (BND), which is arguably the primary estimate of the crowd’s market sentiment. On this front the trend remains choppy and stuck in a holding pattern. In effect, this indicator is advising that a wait-and-see strategy is still warranted.

Learn To Use R For Portfolio Analysis
Quantitative Investment Portfolio Analytics In R:
An Introduction To R For Modeling Portfolio Risk and Return
By James Picerno