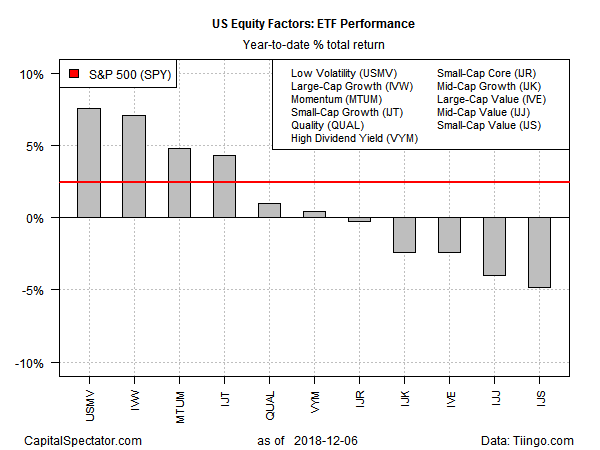
The latest bout of turbulence in the stock market has reshuffled leadership for US equity factor strategies, leaving the low-volatility strategy as this year’s front runner, based on a set of ETFs. Growth and momentum are still posting gains this year, but they’re now trailing, slightly, low vol. One thing that hasn’t changed: value stocks remain in the hole on a year-to-date basis, based on trading for 2018 through yesterday’s close (Dec. 6).
The current year-to-date leader for the main equity factors: iShares Edge MSCI Minimum Volatility USA (USMV), which is up 7.6% so far in 2018. UMSV’s performance edges out the number-two strategy: large-cap growth via iShares S&P 500 Growth (IVW), which is currently posting a 7.1% total return this year. In third place: iShares Edge MSCI USA Momentum Factor (MTUM) with a 4.8% gain.
Turning to the loser’s column for 2018, value is still taking it on the chin. The biggest setback at the moment for the major equity factor strategies is in small-cap value. The iShares S&P Small-Cap 600 Value (IJS) is in the red with a 4.9% loss through yesterday’s close.
Learn To Use R For Portfolio Analysis
Quantitative Investment Portfolio Analytics In R:
An Introduction To R For Modeling Portfolio Risk and Return
By James Picerno
Meantime, the broad equity market, based on SPDR S&P 500 (SPY), is holding on to a small gain for year-to-date performance. Although SPY’s 2.4% total return this year is well behind the factor-strategy leader, the fact that a proxy for US stocks overall is still up for this year in the wake of the recent roller-coaster ride is a testament to the market’s faded but ongoing resilience… at least for the moment.
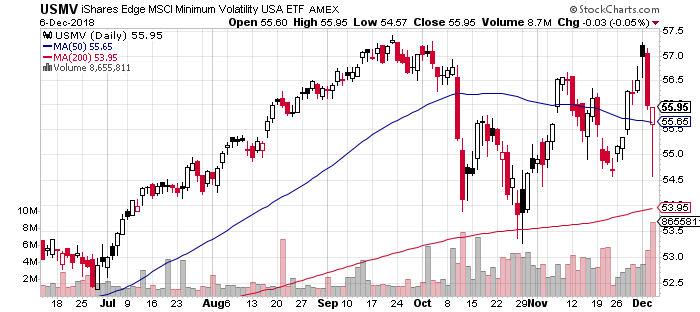
Although low-vol is now the front-runner in 2018’s factor race, this slice of the equity market has suffered its share of, well, volatility in recent history. The main takeaway for USMV of late: it’s been caught in a whipsaw within a trading range for the last two months, closing yesterday at a middling level relative to that zone.
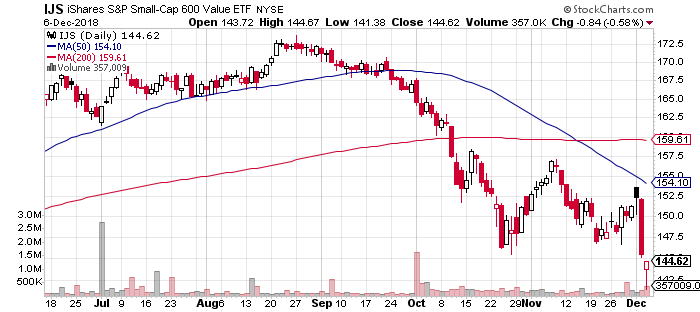
By contrast, small-cap value’s plight looks considerably darker from a trending perspective. As noted, IJS is dead last among among the equity factors this year and the chart below tells us why. After yesterday’s session, IJS slipped deeper into the red, falling to its lowest close since February.
Although equities generally have been on the defensive lately, slicing and dicing stocks through a factor lens reminds that the pain hasn’t been dispensed evenly. That’s clue for thinking that the rebound (whenever that arrives) will be equally uneven.
For additional research on the factor ETFs cited above, here are links to the summary pages at Morningstar.com:
iShares Edge MSCI Min Vol USA (USMV) – low-volatility
Vanguard High Dividend Yield ETF (VYM) – high-dividend yields
iShares Edge MSCI USA Quality Factor (QUAL) – quality stocks
iShares Edge MSCI USA Momentum Factor (MTUM) – price momentum
iShares Core S&P Small-Cap (IJR) – small-cap core
iShares S&P Small-Cap 600 Value (IJS) – small-cap value stocks
iShares S&P Small-Cap 600 Growth (IJT) — small-cap growth
iShares S&P Mid-Cap 400 Growth (IJK) — mid-cap growth
iShares S&P Mid-Cap 400 Value (IJJ) – mid-cap value stocks
iShares S&P 500 Value (IVE) – large-cap value stocks
iShares S&P 500 Growth (IVW)
Is Recession Risk Rising? Monitor the outlook with a subscription to:
The US Business Cycle Risk Report