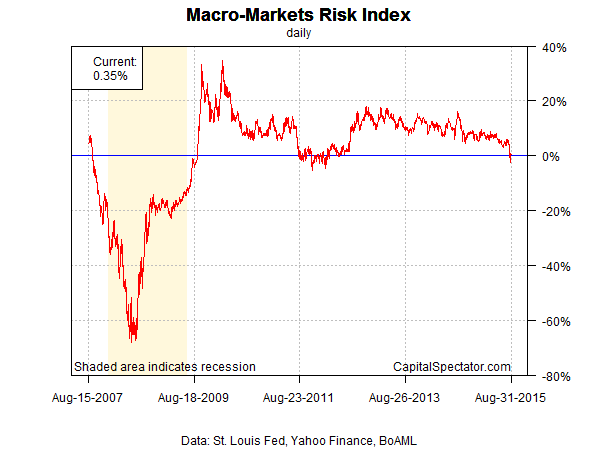
US economic risk increased at the end of August, according to a markets-based estimate of macro conditions. The Macro-Markets Risk Index (MMRI) closed at +0.4% yesterday (August 31) after briefly slipping into mildly negative territory for several days last week. MMRI’s temporary dip into the red in late-August marks the first negative readings since early 2012. It’s important to note that while a markets-based view of the business cycle has turned cautious lately, there’s no confirming support in the hard economic data–at least not based on published numbers to date.
Meantime, a markets-based measure of the business cycle is flashing a warning sign for the US economic outlook. A decline below 0% in MMRI indicates that recession risk is elevated while readings above 0% imply that the economy will expand in the near-term future.
Analyzing market-price data in the financial and commodities markets with a probit model also suggests that business-cycle risk has increased. Nonetheless, the current probit-based reading remains well short of an all-out recession call.
Let’s take a closer look at the numbers, starting with MMRI, which represents a subset of the Economic Trend & Momentum indices (ETI and EMI), a pair of benchmarks that track the economy’s broad trend for signs of major turning points in the business cycle via a diversified set of indicators. (For details about ETI and EMI, see my book on monitoring the business cycle.) Analyzing the market-price components separately offers a real-time approximation of macro conditions, according to the “wisdom of the crowd.” Why look to the financial and commodity markets for insight into the economic trend? Timely signals. Conventional economic reports are published with a time lag. MMRI is intended for use as a supplement for developing real-time perspective until a complete data set is published for updating the monthly economic profile.
MMRI measures the daily median change of four indicators based on the following calculations;
• US stocks (S&P 500), 250-trading day % change
• Credit spread (BofA ML US High Yield Master II Option-Adjusted Spread), inverted 250-trading day % change
• Treasury yield curve (10-yr Treasury yield less 3-month T-bill yield)
• Oil prices (iPath S&P GSCI Crude Oil Total Return Index ETN (OIL)), inverted 250-trading day % change
Here’s how MMRI compares on a daily basis since August 2007:
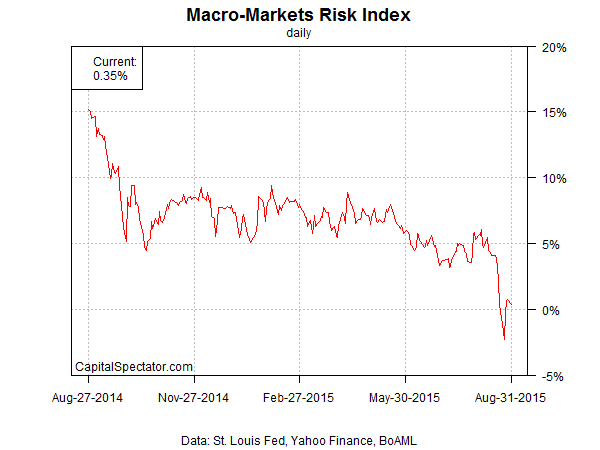
The next chart shows the daily values for MMRI over the last 12 months on a daily basis:
For another real-time approximation of recession risk, let’s review market prices via a probit model. The current estimate shows that business-cycle risk has increased lately, rising to the highest level since 2012. Even so, the probability that an NBER-defined recession has started for the US remains a relatively low-probability event–roughly 18%, as of Aug. 31. This estimate is based on a probit model that crunches the numbers on four data sets: the US stock market (S&P 500); the Treasury yield curve (10-year yield less the 3-month T-bill yield); the credit spread (BAA-rated bond yield less AAA yield); and spot crude oil prices (based on the US benchmark, West Texas Intermediate). For details, see this summary.
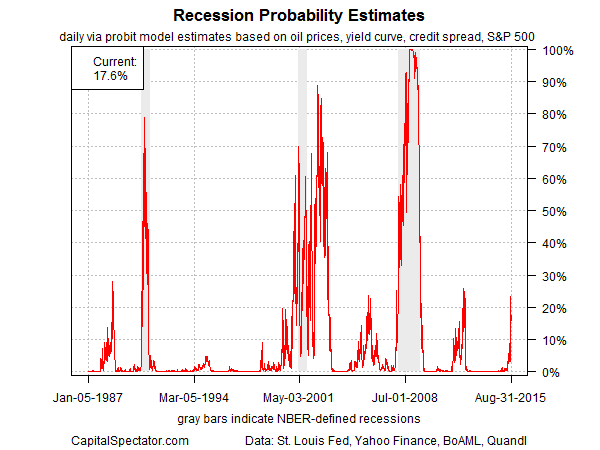
Let’s remember that market-based forecasts of economic conditions are hardly flawless. Back in 2012, business cycle risk was also on the rise, according to a markets-based view of the macro outlook. The warning turned out to be a false signal in terms of anticipating an NBER-defined recession. That said, the upcoming economic reports deserve close attention for deciding if the current markets-based warning is the genuine article this time.
At the very least, markets are pricing in the heightened probability of slower growth. If there’s something darker lurking in the near-term future, we’ll see the evidence in the economic releases in the weeks ahead.
Does the Markov model suggest a regime shift is underway?
Gary,
Yes… and no. Yes: my HMM analysis shows that a bear market began as of last week, based on daily data for the S&P 500 via rolling 1-year % returns. Using monthly data, however, leaves some room for guessing. Again using the S&P 500 with rolling 1yr return shows elevated risk of a bear market (~40%), but this hasn’t (yet) translated into an outright regime change shift in terms of a binary yeah or nay. Nonetheless, it’s fair to say that bear market risk has increased lately by more than a trivial degree, or so this econometric test advises.
–JP
PS–for some background on HMM (Hidden Markov model), see these posts:
http://www.capitalspectator.com/looking-for-bear-markets-with-a-hidden-markov-model
http://www.capitalspectator.com/stock-market-regime-shifts-in-real-time-a-test/
http://www.capitalspectator.com/monitoring-bear-market-risk/