The US stock market is sliding in what may or may not presage an extended decline. Whatever unfolds in the weeks and months ahead, the first order of business is recognizing that we’ve been here before by putting the current correction into historical perspective. There’s nothing new under the sun for market corrections, but it can appear otherwise if you’re overwhelmed with recency bias.
Let’s start by showing that the S&P 500 Index has fallen to levels last seen in March 2021. Painful, but hardly extreme relative to market’s epic gains in recent years.

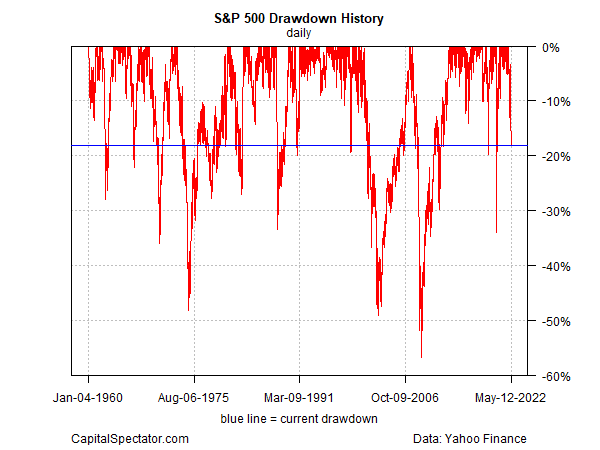
Nonetheless, let’s not dismiss the fact that the current drawdown is no longer a garden-variety pullback. The current S&P 500 drawdown is roughly -18%, which is deep enough so that it’s no longer accurate to label it noise.
Another way to put the current slide into perspective is by looking at rolling one-year returns (252 trading days). On that basis, the current correction (a 4.4% year-over-year drop) is also looking deeper than usual.

Putting the history of one-year returns into a boxplot offers a clearer view of the distribution history. The next chart shows that the current -4.4% change is below the interquartile range (gray box), which offers statistical support for labeling the decline deeper than usual.

At some point the selling will go too far, setting the market up for a substantial and perhaps sustained bounce. Deciding when that point is near is tricky because every correction/bear market is different and is subject to different catalysts. Add in the perennial fact that the future’s always unclear and we have a fresh reminder that staying humble on forecasting is always relevant. On a purely statistical basis, however, the analytics above suggest that there’s still more than a trivial chance that the decline could worse before it gets better.
For another view, consider a proprietary index maintained by CapitalSpectator.com that measures so-called sentiment momentum, based on seven metrics (see here for details).

Here, too, we see that the market’s downside move, while relatively deep, may have further to go, if the deepest declines of the past two decades are a guide. That said, we may be nearing a point of maximum pain unless all hell breaks loose, which can’t be ruled out in the current environment. At the same time, keep in mind that few previous selling waves have been as fierce as the current rout. That doesn’t mean it can’t get worse. But it’s becoming clear that the worst of the decline may be behind us in terms of the near-term outlook.
Learn To Use R For Portfolio Analysis
Quantitative Investment Portfolio Analytics In R:
An Introduction To R For Modeling Portfolio Risk and Return
By James Picerno