Morningstar recently observed that accurately assessing the directional strength or weakness of the US labor market requires a broad review of factors. Correctly advising in December that the weak print for the then-current payrolls report (November) was “likely just a blip given strength,” based on a more expansive read of economic data. The analysis inspires a deeper look into macro factors in search of perspective to the question: What’s relevant (or not) for evaluating labor market activity?
It’s an important question, especially now, when the risk of a US recession appears to be rising. A major variable for monitoring the economy’s strength, or lack thereof, is the labor market (defined as nonfarm payrolls). For the moment, the trend in payrolls remains healthy, at least through February. But blowback is building due to Russia’s invasion of Ukraine. In turn, what macro factors will be the leading drivers of changes, for good or ill, for the labor market?
There are no easy or fail-safe answers, but a useful way to begin is by running a simple linear regression on a set of key economic and financial-market factors. For instance, let’s crunch the data for nonfarm payrolls vis-à-vis the following 12 factors:
* Employment-to-Population Ratio
* Average Hourly Earnings of Production/Nonsupervisory Employees
* Jobless Claims
* Industrial Production
* Personal Income
* Consumer Spending
* Bank Loans and Leases in Bank Credit
* Moody’s Seasoned Baa Corporate Bond Yield
* Housing Starts
* Gasoline Prices
* 10-year Treasury Yield
* US Stock Market (Wilshire 5000 Index)
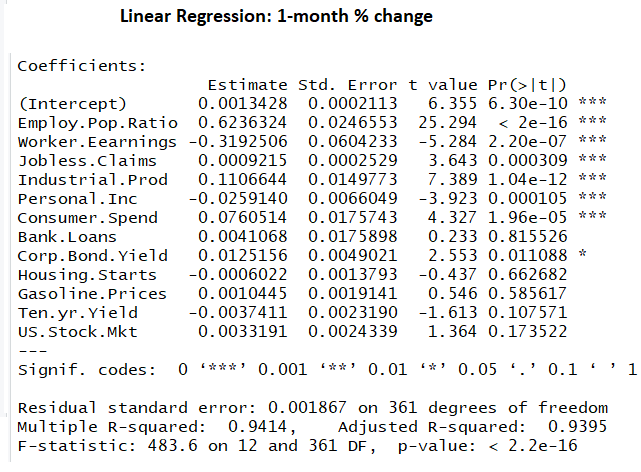
The start date for the monthly data is September 1990 and runs through January 2022, based on numbers from the St. Louis Fed’s FRED database. For perspective, we’ll run the analysis on three time frequencies: monthly, six-month and one-year percentage changes.
Let’s start with monthly. The first cut of identifying factors that resonate is looking for statistically significant relationships, indicated in the far-right column by one or more asterisks. On that basis, some datasets appear more relevant than others.
For more context, I also ran the analysis based on six-month and one-year changes.


One way to sift through the results is to focus on results where significance is consistent across the three sets of frequencies. On that basis, just three make the cut:
* Employment-to-Population Ratio
* Industrial Production
* Moody’s Seasoned Baa Corporate Bond Yield
If we loosen the standard and look for factors that show up on any two of the three time frequencies the list also includes:
* Bank Loans and Leases in Bank Credit
* Jobless Claims
* 10-year Treasury Yield
* US Stock Market (Wilshire 5000 Index)
Yes, we should be cautious on reading too much into these results. But as a first approximation of where to focus, this analysis provides an intriguing and somewhat surprising basis for a deeper review.
How is recession risk evolving? Monitor the outlook with a subscription to:
The US Business Cycle Risk Report