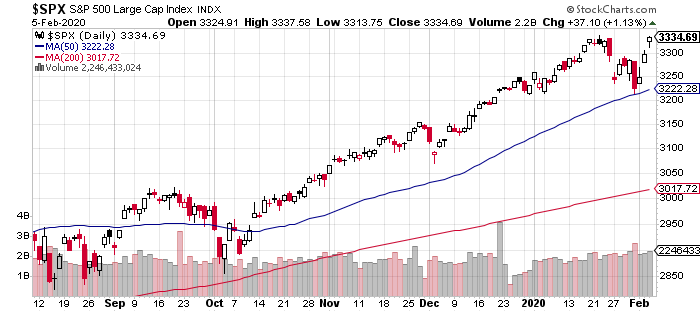
The US stock market (S&P 500) rallied to a record high on Wednesday (Feb. 5), which unleashed fresh warnings from some corners of elevated bubble risk. Perhaps, but whenever you hear someone claim with authority that there’s a bubble, and it’s about to burst, ask the oracle what model he’s using.
Talking about bubbles is easy; defining one is something else entirely. Discussions on this topic often say more about a person’s behavioral bias rather than reveal any strategic insight about the market’s current asset pricing. Another complication: what looks like a bubble to an observer using a prudent definition may appear to be the normal ebb and flow of fluctuating ex ante risk premia to someone else.
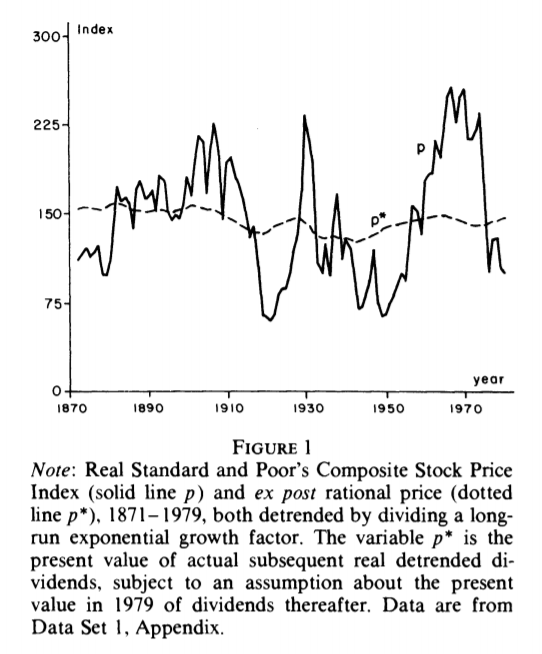
Debates about bubbles tend to divide the world into two main camps: investors who think the market is (mostly) efficient and those who see it as (mostly) inefficient. The economic basis for this divide can be traced to a famous 1981 paper by Professor Robert Shiller, who presented the case that the stock market bounces around more than warranted from the perspective dividends (“Do Stock Prices Move Too Much to be Justified by Subsequent Changes in Dividends?”), as summarized in the chart below.
Subsequent research over the years has revealed that the subject of market bubbles isn’t as cut and dry as Shiller’s 1981 analysis implies. For example, Professor John Cochrane in 2013 outlined an alternative explanation that resonates with many academics and investors:
You might think that high prices relative to current dividends mean that markets expect dividends to be higher in the future. Sometimes, you’d be right. But on average, times of high prices relative to current dividends (earnings, book value, etc.) are not followed by higher future dividends. On average, such times are followed by lower subsequent long-run returns.
Shiller’s graph we now understand as such a regression: price-dividend ratios do not forecast dividend growth. Fortunately, they do not forecast the third term, long-term price-dividend ratios, either — there is no evidence for “rational bubbles.” They do forecast long-run returns. And the return forecasts are enough to exactly account for price-dividend ratio volatility!
Finally, the debate over “bubbles” can start to make some sense. When Shiller says “bubble,” in light of the facts, he can only mean “time-variation in the expected return on stocks, less bonds, which he believes
is disconnected from rational variation in the risk premium needed to attract investors.” When Fama says no “bubble,” he means that the case has not been proven, and it seems pretty likely the variation in stock expected returns does correspond to rational, business-cycle related risk premiums.
From a practical perspective, trying to manage your portfolio based on bubble analysis is probably misguided. Market timing is difficult generally, and it’s even more challenging if the primary input is estimating bubble risk. Consider how many times some “respected” market pundit over the past decade has breathlessly warned that the market was in a bubble and you begin to understand the hefty opportunity cost that’s embedded in such advice (hint: the S&P 500’s up 200%-plus over the past 10 years).
Is Recession Risk Rising? Monitor the outlook with a subscription to:
The US Business Cycle Risk Report
Yes, the market does suffer drawdowns and so thinking clearly about bubble risk doesn’t immunize investing strategies from loss. History reminds that S&P 500 peak-to-trough declines can be brutal at times. How much of this drawdown history is related to bubble risk, however, is debatable. There are many things that can derail a bullish market trend, and bubbles are but one entry on a long list of demons.
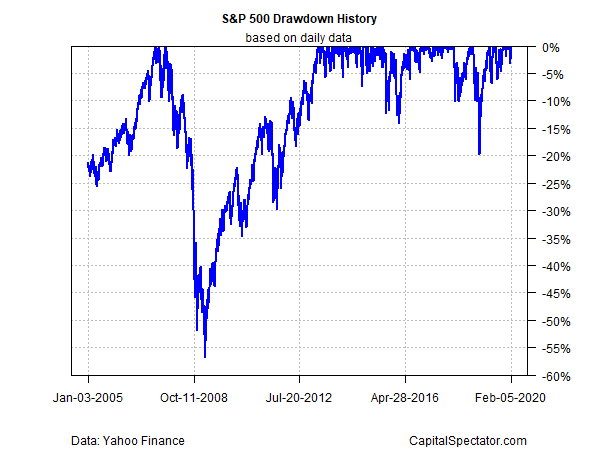
In any case, drawdowns tend to be relatively moderate, brief affairs. But if your risk tolerance is low, the stronger the case for the standard prescription – building multi-asset class portfolios, periodic rebalancing, selecting asset weights to align with your capacity (or lack thereof) for short-term loss, etc.
Does that mean the only reasonable course for risk management is to ignore bubble talk entirely? No, although to the extent that you’re inclined to embrace this factor it’s best to do so as part of a broader set of variables. In another words, don’t bet the farm on bubble estimates. In addition, favor bubble analytics that are heavy on objective, quantitative applications and light on warm and fuzzy narratives that play well in TV interviews.
There are a number of quant-based methods for assessing bubble risk. One that The Capital Spectator favors as a first approximation for real-time bubble analysis: testing for unit roots (for some background, see this overview). As an example, here’s how bubble risk currently stacks up for the S&P 500 via a rolling one-year-return filter:
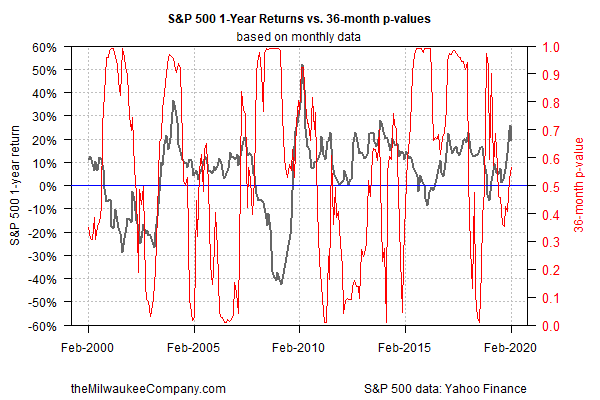
By this definition, bubble risk looks middling at the moment. That’s no assurance against a market swoon. But in the grand scheme of bubble analysis this is one clue for thinking that if the market does tumble in the immediate future the catalyst will likely be something other than elevated bubble risk.
Learn To Use R For Portfolio Analysis
Quantitative Investment Portfolio Analytics In R:
An Introduction To R For Modeling Portfolio Risk and Return
By James Picerno
Pingback: Bubble Talk - TradingGods.net