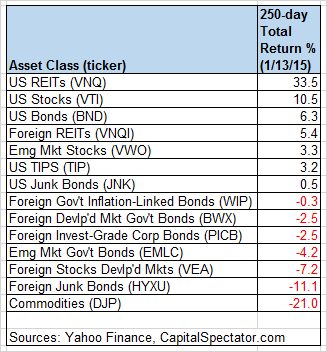
Securitized real estate is crushing the competition. The global markets have turned wobbly lately, but you wouldn’t know it by looking at the recent performance for real estate investment trusts. US REITs are far and away the best performer among the major asset classes via our standard list of ETF proxies over the past 12 months. Vanguard REIT (VNQ) has climbed an impressive 33.5% on a total return basis through yesterday (Jan. 13), based on the trailing one-year period (defined here as the past 250 trading days). The number-two performer—US stocks, broadly defined via Vanguard Total Stock Market (VTI)—is far off in the rear-view mirror with a 10.5% advance.
There’s plenty of drama at the opposite end of the performance spectrum too. A broad measure of commodities continues to slide. The iPath Bloomberg Commodity Index ETN (DJP) is the worst performer over the past 250 trading days, tumbling 21.0% through yesterday’s close.
The divergence between the winners and losers has become unusually wide in recent weeks. Indeed, more than 50 percentage points now separates the leading and lagging performers at the extremes for the trailing 250-day period.
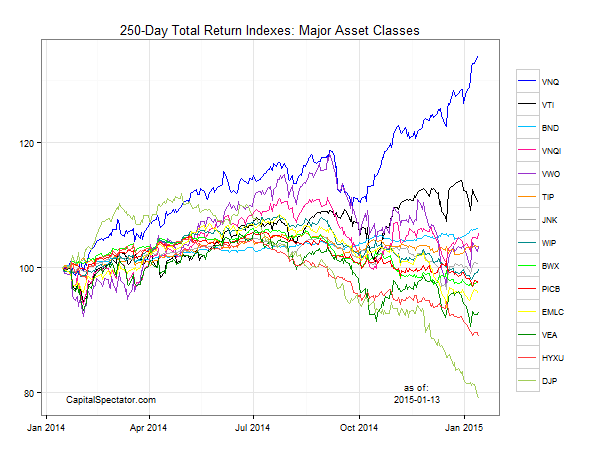
Here’s a graphical recap of the relative performance histories for each of the major asset classes for the past 250 trading days via the ETF proxies. The chart below shows the performance records through Jan. 13, 2015, with all the ETFs rebased to a starting-value of 100. Note the sharp divergence between the top performer (REITs, blue line at top) vs. commodities (green line at bottom).
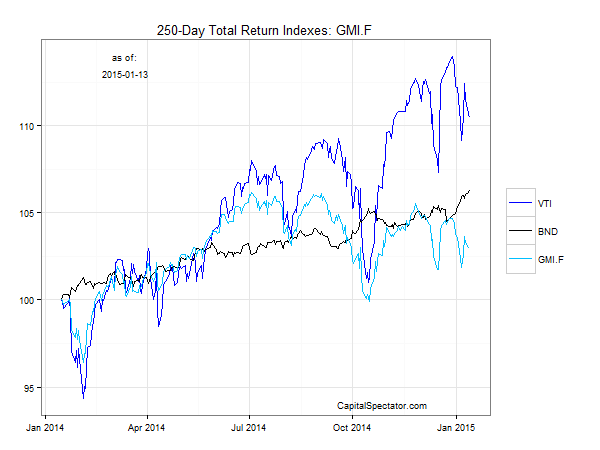
Now let’s review an ETF-based version of an unmanaged, market-value-weighted mix of all the major asset classes — the Global Market Index Fund, or GMI.F, which holds all the ETFs in the table above. Here’s how GMI.F stacks up for the past 250 trading days through Jan. 13, 2015. This investable strategy is up a tepid 3.0% over that span — well below the performance for US stocks (VTI) and US bonds (BND). Weighing on GMI’s recent performance: the low return in foreign-developed stocks and the moderate loss in government bonds in developed countries over the trailing 250-day period.
Comparing the median dispersion for 250-day returns for the major asset classes via ETFs suggests that the general rebalancing opportunity continues to improve for GMI.F vs. recent history. Analyzing the components of GMI.F with a rolling median absolute deviation via one-year returns for the ETFs — the GMI.F Rebalancing Opportunity Index, as it’s labeled on these pages — suggests that there’s enhanced potential for adding value by reweighting this portfolio in comparison with recent history. Keep in mind that the opportunity for productive rebalancing will vary depending on the choice of holdings and historical time window. In addition, don’t overlook the possibility that any given pair of ETFs may present a substantially greater or lesser degree of rebalancing opportunity vs. analyzing GMI.F’s components collectively, which is the methodology that’s reflected in the chart below. Also, the chart below focuses on looking backward — if you’re confident in your forecast for risk and return, the ex ante view of rebalancing opportunity may paint a distinctly different outlook vs. an ex post analysis.

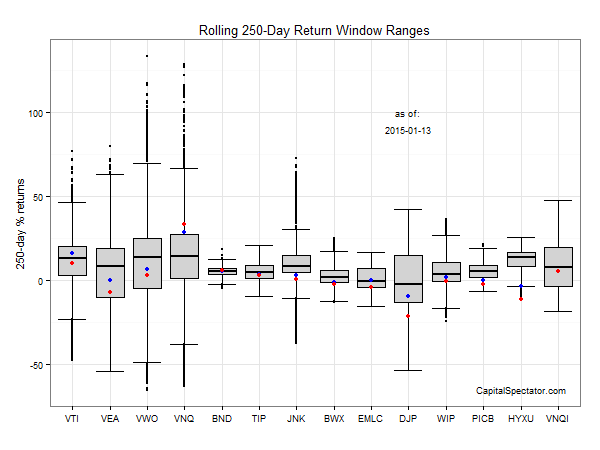
Finally, let’s compare the rolling one-year returns for the ETFs in GMI.F via boxplots for a revealing comparison of price momentum. The gray boxes in the chart below reflect the middle range of historical 250-day returns for each ETF—i.e., the 25th to 75th return percentiles. The red dots show the current return (as of Jan. 13) vs. the 250-day return from 30 trading days earlier (blue dots, which may be hiding behind the red dots in some cases). Once again we see REITs (VNQ) and commodities (DJP) at the extremes.
The ETF Asset Class Performance Review, which offers a deeper look
at an ETF-based view of asset classes. For more information and a
recent sample, see CapitalSpectator.com/premium.