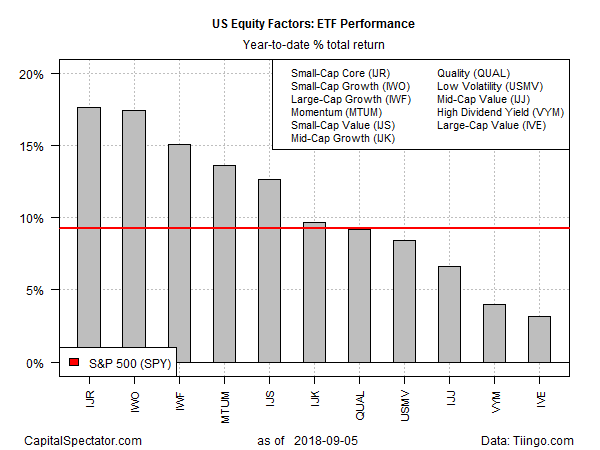
Year-to-date returns for US equity investing are still dominated by small-cap and growth factors, based on a set of exchange-traded funds (ETFs). By contrast, large-cap-value stocks are currently posting the weakest gain so far in 2018 among the main equity factor buckets.
At the front of the factor horse race is a broad small-company fund: iShares Core S&P Small-Cap (IJR), up a sizzling 17.7% so far this year through Wednesday’s close (September 5). Although the ETF has eased in recent days, it’s still close to an all-time high.
Nipping at IJR’s heels: a small-cap ETF with a growth bias. The second-strongest factor performance year to date is found in iShares Russell 2000 Growth (IWO), which is posting a 17.4% total return so far in 2018.
A New Book On Using R For Portfolio Analysis
Quantitative Investment Portfolio Analytics In R:
An Introduction To R For Modeling Portfolio Risk and Return
By James Picerno
Large-cap growth stocks are in third place. The iShares Russell 1000 Growth (IWF) is ahead by 15.1% this year.
Wallowing in last place: large-cap value stocks: iShares S&P 500 Value (IVE) is posting a relatively weak 3.2% total return in 2018 through yesterday’s close.
For context, note that the broad US equity market – SPDR S&P 500 (SPY) – is up 9.2% this year.
Although stocks in the US have been outperforming the other major asset classes in recent history by a wide margin, some analysts still see another leg up for equities. A key factor that hints at more gains: a strong manufacturing sector, advises Tony Dwyer, equity strategist at Canaccord Genuity. Writing in a recent research note, he predicts the S&P 500 Index (currently at roughly 2889) will rise another 11% to 3200 by the end of the year.

“The Institute for Supply Management showed that the manufacturing sector remains on very solid ground,” Dwyer wrote. “History shows that since 1950, the ISM typically peaks well before the economy enters recession or the S&P 500 hits the cycle high, especially over the past three levered economic periods.”
By that standard, the ISM’s jump to a 14-year high in August is encouraging. But skeptics point out that there was no confirmation in the ISM’s bullish signal via yesterday’s update of the US Manufacturing PMI, which eased to a nine-month low last month. “Manufacturers reported the smallest output rise for almost a year in August, suggesting production growth could be as weak as 0.2% in the third quarter,” says Chris Williamson, chief business economist at IHS Markit, which publishes the PMI data.
The good news is that the broad macro trend still looks encouraging. Yesterday’s nowcast for third-quarter GDP growth via the Atlanta Fed’s GDPNow model, for example, continues to anticipate a strong gain. If accurate, Q3 growth will deliver a second quarter of 4.0%-plus growth. If so, it may still be premature to call the end of the long-running bull market for US stocks.
Yet there’s no shortage of analysts warning that the hour is late. For example, Bloomberg on Wednesday reported:
Goldman Sachs Group Inc.’s bull/bear market indicator has risen to what it says is an alarmingly high level. The measure has shown a close relationship with the S&P 500’s forward returns since 1955, with peak readings coinciding with the start of the last two bear markets, according to Bloomberg News’s Lu Wang. Citigroup Inc. strategists are urging investors to cut back on risk as Friday’s jobs market report could show robust wage gains, which could fuel inflation concerns and spark a sell-off just like in February.
Based on the current trend profile for most slices of the US stock market, however, the case for expecting another leg up remains plausible, albeit debatable. Indeed, after nine years of gains, concern is spreading among investors that it’s late in the game.
One exception: Charlie Farrell, CEO of Northstar Investment Advisors. He advised last week that the big picture still looks productive. “Generally, bear markets start when something derails economic growth, and right now, things look reasonably good,” he writes. “The economy is growing steadily, interest rates are low, inflation is low and unemployment is low; all basically good signs.”
At the moment, Mr. Market agrees.
For additional research on the factor ETFs cited above, here are links to the summary pages at Morningstar.com:
iShares Edge MSCI Min Vol USA (USMV) – low-volatility
Vanguard High Dividend Yield ETF (VYM) – high-dividend yields
iShares Edge MSCI USA Quality Factor (QUAL) – so-called quality stocks
iShares Edge MSCI USA Momentum Factor (MTUM) – price momentum
iShares Core S&P Small-Cap (IJR) – small-cap core
iShares S&P Small-Cap 600 Value (IJS) – small-cap value stocks
iShares Russell 2000 Growth (IWO) — small-cap growth
iShares S&P Mid-Cap 400 Growth (IJK) — mid-cap growth
iShares S&P Mid-Cap 400 Value (IJJ) – mid-cap value stocks
iShares S&P 500 Value (IVE) – large-cap value stocks
iShares Russell 1000 Growth — large-cap growth
Why use IWO over IJT when you used IJS over IWN?
Pingback: US Equity Investing Dominated by Small-Cap and Growth Factors - TradingGods.net
Sam,
You make a good point. The factor list I’ve been using for these blog posts has evolved in fits in starts. More consistency is required. I’ll update the list for the next update. Thanks.
–JP