Recession risk in the US remained low in the kick-off month for the third quarter, based on a broad set of economic and financial indicators. Although economic growth remains modest, the available data through July suggests that the broad macro trend was still firmly positive.
The outlook for the expansion remains a work in progress, however. The Wall Street Journal’s survey of economists this month projects a modest acceleration in Q3 GDP growth to 2.7% from 2.3% in Q2 (seasonally adjusted annual rate). But the Atlanta Fed’s new GDPNow projection throws cold water on that forecast–the bank’s current Q3 estimate anticipates deceleration to a tepid 1.3% rise for GDP, based on the Aug. 18 nowcast. In other words, the expected pace of growth for the near term is still open for debate. Nonetheless, the published numbers to date strongly suggest that last month wasn’t the start of a new downturn for the US.
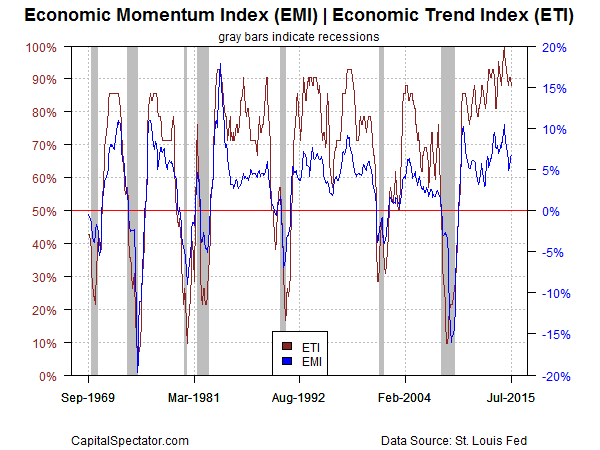
Using a methodology outlined in Nowcasting The Business Cycle: A Practical Guide For Spotting Business Cycle Peaks, an aggregate of economic and financial trend behavior shows that business-cycle risk remained low through last month. The Economic Trend and Momentum indices (ETI and EMI, respectively) are still at levels that equate with expansion. The current profile of published indicators through last month (12 of 14 data sets) for ETI and EMI reflect a positive trend overall. The exceptions at this point: the corporate bond spread and the real monetary base.
Here’s a summary of recent activity for the components in ETI and EMI:

Aggregating the data into business cycle indexes reflects positive trends overall. The latest numbers for ETI and EMI indicate that both benchmarks are well above their respective danger zones: 50% for ETI and 0% for EMI. When the indexes fall below those tipping points, we’ll have clear warning signs that recession risk is elevated. Based on the latest updates for July — ETI is 88.1% and EMI is 6.7% — there’s still a wide margin of safety between current values and the danger zones, as shown in the chart below. (See note at the end of this post for ETI/EMI design rules.)
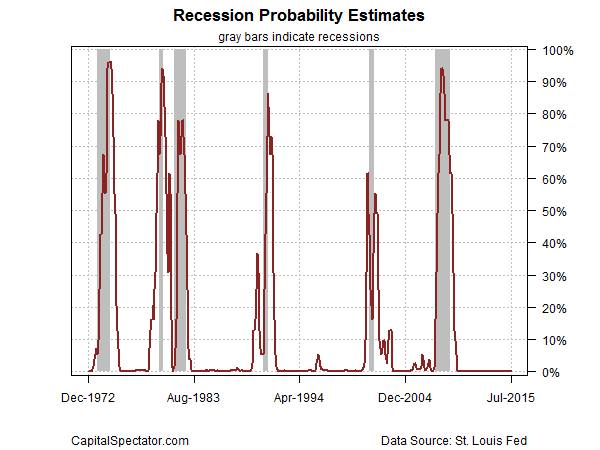
Translating ETI’s historical values into recession-risk probabilities via a probit model also points to low business cycle risk for the US. Analyzing the data with this methodology implies that the odds are virtually nil that the National Bureau of Economic Research (NBER) — the official arbiter of US business cycle dates— will declare last month as the start of a new recession.
For another perspective, consider how ETI may evolve as new data is published. One way to project future values for this index is with an econometric technique known as an autoregressive integrated moving average (ARIMA) model, based on calculations via the “forecast” package for R, a statistical software environment. The ARIMA model calculates the missing data points for each indicator, for each month through September 2015. (Note that May 2015 is currently the latest month with a complete set of published data.) Based on today’s projections, ETI is expected to remain well above its danger zone for the near term.

Forecasts are always suspect, of course, but recent projections of ETI for the near-term future have proven to be relatively reliable guesstimates vs. the full set of published numbers that followed. That’s not surprising, given the broadly diversified nature of ETI. Predicting individual components, by contrast, is prone to far more uncertainty in the short run. The latest projections (the four black dots on the right in the chart above) suggest that the economy will continue to expand. The chart above also includes the range of vintage ETI projections published on these pages in previous months (blue bars), which you can compare with the actual data that followed, based on current numbers (red dots). The assumption here is that while any one forecast for a given indicator will likely miss the mark, the errors may cancel out to some degree by aggregating a broad set of predictions. That’s a reasonable assumption when we review the historical record for the ETI forecasts.
For additional perspective on judging the track record of the forecasts, here are the previous updates for the last three months:
20 Jul 2015
17 Jun 2015
20 May 2015
Note: ETI is a diffusion index (i.e., an index that tracks the proportion of components with positive values) for the 14 leading/coincident indicators listed in the table above. ETI values reflect the 3-month average of the transformation rules defined in the table. EMI measures the same set of indicators/transformation rules based on the 3-month average of the median monthly percentage change for the 14 indicators. For the chart showing EMI and ETI through last month, and for the near-term forecasts, the missing data points are estimated with an ARIMA model.
Pingback: Wall Street National | Is The U.S. Economy Headed For Trouble This Fall? - Wall Street National
Pingback: US Retail Sales Rise Slightly