The spring/summer rally for the S&P 500 Index has faded, but the pullback still leaves the market positioned to post one of its stronger calendar-year gains in decades. The obvious caveat: a lot can happen between now and Dec. 31. But for the moment, American shares reflect a robust bull run for the year to date.
The question lingers about whether this year’s gains are a bear-market rally. One reason for considering that possibility: the market has yet to regain its January 2022 high. In an upcoming post I’ll take a closer look at that debate. But first, let’s put 2023’s rise into historical context.
The main takeaway: Few calendar-year rallies since 1950 beat the current rise, as the chart below shows. The S&P 500 is up 13.5% year to date through Tuesday’s close (Oct. 10), which is shown by the red line. That’s a dramatic reversal from last year’s steep loss (blue line).
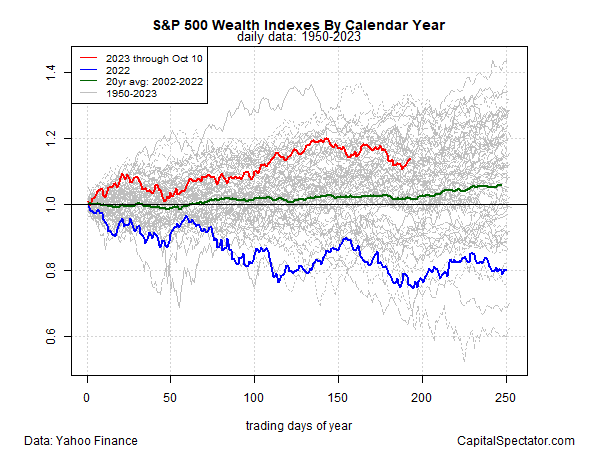
This year’s rally is also sharply higher than the average 20-year change for the market (2002-2022), shown by the green line.
Comparing 2023’s results to date in the context of every calendar year since 1950 (gray lines) puts this year’s increase just below the 75th percentile. In other words, 2023’s advance beats 75% of calendar year returns for the past seven decades. Not too shabby.
The question is whether this year’s pop is a temporary reaction to last year’s steep loss? In an upcoming post I’ll dig into that question. Meantime, it’s fair to say that a hefty dose of mean reversion remains in play.
Learn To Use R For Portfolio Analysis
Quantitative Investment Portfolio Analytics In R:
An Introduction To R For Modeling Portfolio Risk and Return
By James Picerno