The CAPE that Cried Wolf
Dino Palazzo (Board of Governors of the Federal Reserve System)
May 2026
The Capital Spectator’s Takeaway
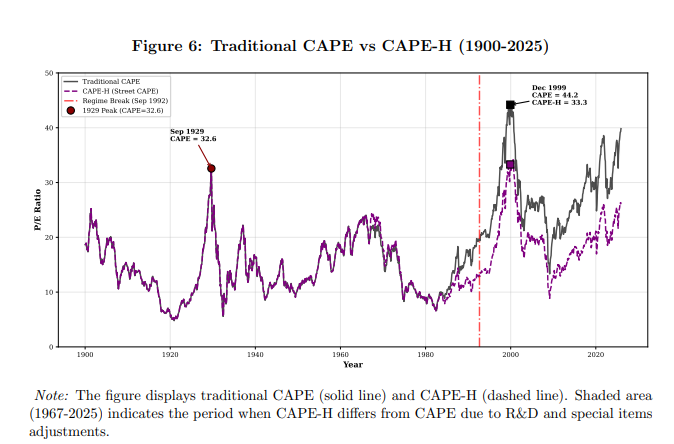
The paper reports that traditional CAPE ratio’s false warnings of market overvaluation since the 1990s are an accounting illusion caused by mandatory R&D expensing and volatile special-item write-downs. By stripping out these regulatory distortions, CAPE-H eliminates the apparent structural break and restores CAPE’s ability to accurately predict long-term price appreciation and excess stock market returns.
Abstract
The “dog that did not bark”-the absence of dividend-growth predictability (Cochrane, 2008)-implies time-varying expected returns, yet the cyclically adjusted price-earnings (CAPE) ratio has “cried wolf” in the post-Global Financial Crisis period, persistently signaling mean reversion that failed to materialize. Since the early 1990s, CAPE has exhibited a persistent structural break and weak out-of-sample performance (Goyal and Welch, 2008; Lettau and Van Nieuwerburgh, 2008). This apparent breakdown can be largely attributed to systematic earnings distortions arising from accounting changes interacting with intangible capital growth. Mandatory R&D expensing increasingly understates reported earnings, while expanded special items recognition introduces transitory volatility that contaminates long-horizon averages. We construct CAPE-H (Historically-comparable CAPE), restoring intertemporal comparability by correcting both distortions. Decomposing returns, we show that the failure of traditional CAPE arises from a breakdown in predicting price appreciation, while dividend growth remains essentially unpredictable under both measures. CAPE-H reestablishes predictability in excess returns, consistent with valuation-based mean reversion, by restoring the link between valuations and subsequent price appreciation.
Persistence and innovation in the momentum signal
Doojin Ryu (Sungkyunkwan University)
May 2026
The Capital Spectator’s Takeaway
The momentum premium is primarily driven by predictable stock risk rather than temporary mispricing, though unexpected price shocks offer distinct high-alpha opportunities in smaller stocks. By decomposing past stock returns into a predictable trend and a forecast-error “innovation,” the research reveals that predictable persistence accounts for most momentum profits but is largely absorbed by standard risk factors. In contrast, unexpected innovations generate true risk-adjusted alpha—particularly among smaller and mid-tier momentum stocks—while extreme winner and loser stocks eventually see these unexpected price shocks reverse.
Abstract
By separating the momentum indicator into a predictable persistent component and a forecast-error innovation, we examine how each component contributes to the momentum premium. The persistent component absorbs most of the momentum profit, challenging a pure transitory-mispricing interpretation of momentum. The innovation component earns a smaller positive premium, concentrated among non-extreme momentum stocks but reversed at the extremes.
Crowded Anomalies over the Business Cycle
Dennis Jung (Technical University of Darmstadt)
May 2026
The Capital Spectator’s Takeaway
The research advises that different stock market strategies carry different levels of economy-driven risk, allowing you to time your investments based on the business cycle. Instead of generating higher profits all the time, strategies tied closely to the broader economy behave like a coiled spring: they bear brunt during market recessions, but deliver strong, outsized returns during economic recoveries and expansions. By identifying which strategies align best with economic momentum, investors can rotate into the right assets at the right point in the cycle.
Abstract
Anomaly returns vary systematically over the business cycle, yet the literature on factor timing has studied this variation in the time series and remains silent on its cross-sectional allocation. We propose excess centrality, a measure constructed from the difference between an anomaly’s centrality in a macro-targeted principal-component decomposition and its centrality in standard PCA. The measure isolates the component of systematic exposure that loads on macroeconomic fundamentals and assigns it at the level of individual anomalies. A longonly portfolio formed on the signal matches the equal-weighted benchmark unconditionally but earns its premium cyclically: realised in recovery, contributed in expansion, and absent in recession where the priced risk is borne. The unconditional flatness is the arithmetic signature of a state-dependent premium paid through the cycle rather than the absence of a signal. The findings identify a priced macroeconomic risk premium that conventional factor models do not capture, locate it in identifiable corners of the anomaly cross-section, and extend factor timing from the question of when to scale a given factor to the cross-sectional question of which strategies carry the macroeconomic risk.
Pricing the Federal Reserve’s Inflation Response in Treasury Markets
Keiichi Morimoto (Meiji University)
June 2026
The Capital Spectator’s Takeaway
The post-pandemic market repricing of Federal Reserve rate hikes occurred in two distinct phases: in 2022, markets priced in higher future real interest rates alongside rising inflation expectations, but in 2023, the market underwent a fundamental shift toward higher real rates paired with falling inflation compensation. This structural transition made 2023 the strongest year on record for perceived Fed policy responsiveness, demonstrating to investors that nominal yield spikes alone do not reflect monetary tightening unless real rate hikes successfully bring down long-term market inflation expectations.
Abstract
Using public nominal Treasury and Treasury Inflation-Protected Securities curves, I decompose post-pandemic Treasury repricing into real-rate and inflation-compensation projections measured along the same six-maturity direction. The distinction changes the reading of the tightening cycle. In 2022, real-rate pricing strengthened, but inflation compensation rose even more, leaving the combined response-pricing index weak. In 2023, firmer real-rate pricing was accompanied by lower inflation compensation; that annual configuration ranks above every other analysis year for every positive weighting. Existing research documents a broad post-liftoff increase in perceived Federal Reserve responsiveness. I show that the Treasury repricing behind that shift changed composition between 2022 and 2023. Household three-year inflation expectations and disagreement move inversely with the index, while Federal Open Market Committee path surprises move it upward. The chronology survives presample statistical and term-structure alternatives. Treasury prices determine finite-grid projection coordinates conditional on the representation, not a daily Taylor-rule coefficient separately from other macroeconomic forces, so the measure is a price contrast rather than a structural policy estimate.
Learn To Use R For Portfolio Analysis
Quantitative Investment Portfolio Analytics In R:
An Introduction To R For Modeling Portfolio Risk and Return
By James Picerno

Pingback: Do High Valuations Predict Market Corrections? What CAPE-H Signals at 1, 3, and 5 Years - LifeStonks.com