The decline in oil prices—the US benchmark West Texas Intermediate as of Dec. 1 is down roughly 35% since the recent peak in June 2014 —has inspired bullish expectations for consumer spending and related investments. As the Washington Post noted earlier this week: “Tumbling oil prices are draining hundreds of billions of dollars from the coffers of oil-rich exporters and oil companies and injecting a much-needed boost for ailing economies in Europe and Japan — and for American consumers at the start of the peak shopping season.” The slide in energy prices is also “spurring U.S. mutual fund managers to pick up shares of restaurants, airlines, and retailers, all consumer stocks that have been among the worst performers in the stock market this year,” Reuters reported yesterday.
Globally, lower oil prices are probably a wash in terms of the macro impact. “Falling oil prices have no implications for global growth—it merely redistributes global wealth,” according to Scott Sumner, an economics professor at Bentley University. But the results are likely to vary for individual countries. Economies that export most of their oil output will suffer the most—Russia, Saudi Arabia, and so on. Meantime, nations that have traditionally been net importers of oil—the US, Japan, Germany—will benefit. But how much of an energy stimulus should we expect? Probably less than conventional wisdom suggests. For some perspective, let’s take a brief look at the numbers based on the historical record for the 20 years through October 2014 with monthly data.
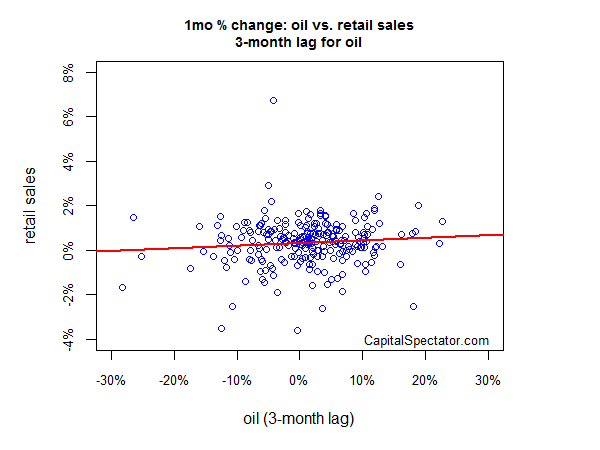
The general assumption is that lower oil prices lead to higher consumer spending. Let’s test this theory by comparing monthly percentage changes in oil prices (WTI) with monthly changes for US retail sales three months down the road. Why the lag? The reasoning is that a fall in energy prices takes some time to work through the economy before providing a boost to spending. (Note: lags in the charts below are referenced in terms of oil prices and so, for example, a December change in retail sales is compared with a September change in oil prices.)
But the historical record on monthly changes doesn’t look terribly encouraging for expecting a big boost in consumption. Indeed, visual inspection shows that the best-fit (red line) via a linear regression is almost flat, which suggests that the fluctuations on a monthly time frame are close to random–the relatively high p-value of 0.16 for the data confirms that there’s no statistically significant relationship. This result isn’t terribly surprising since monthly changes are probably too short to capture a meaningful signal, even with a three-month lag.
When we look at the year-over-year data, however, there’s a moderately positive correlation, which means that higher (lower) oil prices are linked with higher (lower) retail spending. These results raise questions about assuming that lesser oil prices act as a stimulus on spending. Note that the best-fit red line for annual changes slopes up at a steeper angle vs. the monthly changes. The low p-value (4.93e-07) tells us that this relationship is, in fact, statistically significant. In sum, the data doesn’t inspire much confidence for expecting that lower oil prices will lead to a substantial burst in retail sales. This is somewhat counterintuitive, but one explanation is that oil prices tend to rise when economic activity is on an upswing, and vice versa. As a result, it shouldn’t come as a shock to learn that retail spending tends to increase at times when oil prices are trending higher.

Maybe we’re looking at sub-optimal lags in the search for evidence that oil price changes are negatively correlated with retail spending, i.e., that lesser energy prices will juice consumption. As a test, let’s review cross correlation data across a spectrum of lags, starting with monthly percentage changes. Yet it appears that the connection in monthly terms is still random regardless of the number of lags, as the chart below shows. Only the zero-lag data shows a statistically significant relationship (indicated by the red line rising above the upper blue-dotted line). What’s more, the relationship reflects a relatively strong positive correlation.

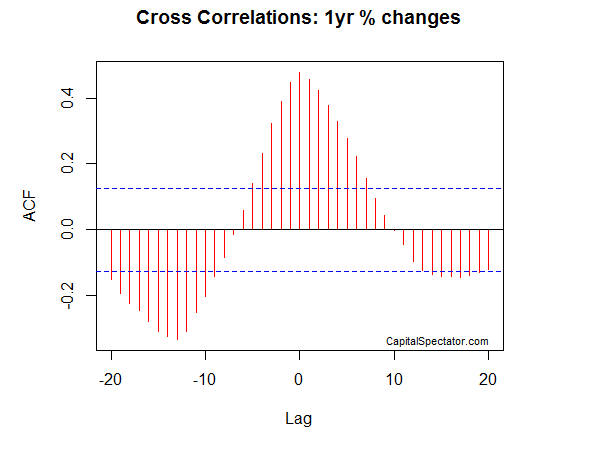
Finally, let’s review cross correlations for one-year changes. We’ve finally struck pay dirt, as the next chart illustrates. In particular, note the statistically significant negative correlations with oil price lags at around negative 12 months (lower left-hand corner of chart). The message is that lower oil prices are linked with higher retail sales a year later, when measured in annual terms. The flip side is that when oil prices rise, it tends to weigh on sales relatively quickly. Still, that’s a thin reed for expecting that oil price changes will trigger a meaningful change in consumption patterns. After all, energy prices are one factor in a complex web of macro inputs that influence retail sales–and a lot can happen over the course of a year.
Overall, we should be cautious in expecting that lesser energy costs will materially impact consumer purchases in the near term. It’s reasonable to assume that falling oil prices will create a kinder, gentler climate for consumption in general terms. But looking for clear, direct and compelling evidence through an econometric lens offers mixed results at best. Instead, it’s best to think of lower energy prices as a mild stimulant for economic activity generally. The effects on Main Street proper, however, are harder to document.
Pingback: Thursday links: grand structural conflict | Abnormal Returns