Mean reversion in asset returns is a familiar subject in the academic and empirical literature, but the use–and abuse–of this core concept is all over the map. Depending on where you look, you’ll find interpretations ranging from “it’s nonsense” to a near-religious embrace of the idea that the performance cycle is all you need to know for developing robust estimates of future results. As usual when navigating through the world of finance and economics, however, reality tends to be somewhere in the middle of the extremes.
If we can’t dismiss mean reversion but can’t swallow it whole hog either, how should we deploy it? Carefully. Much depends on the details for how it’s used and the context with respect to the investment horizon. The output from modeling returns for a rolling one-year horizon the results aren’t terribly useful with a 10-year horizon, and vice versa, for instance. This is partly due to the fact that the longer the horizon, the less likely that we’ll see losses. Returns tend to mean revert around zero for one-year horizons, but ten-year performance suffers far less red ink and the reversion point is a positive return. This point looks like a dealbreaker to some eyes, but It’s a simple matter to adjust the data via, say, z-scores or percentile rank for use in practical applications.
Some folks are quick to dismiss the idea that studying mean reversion for asset returns is productive on any front, but that’s too harsh. As Vanguard-founder John Bogle observed,
reversion to the mean—RTM, the pervasive law of gravity that prevails in the financial markets—never stops. While its drumbeat is hardly regular, it never fails. For the returns of market sectors, of managed investment portfolios, and even of the market itself mysteriously return, over time, to norms of one kind or another.
The details, however, can get messy, depending on what you’re trying to accomplish. Coming up with simple rules that are universally applicable for every application is hopeless. But a bit of tweaking yields valuable perspective. By some accounts, reversion to the mean shines brightest when filtered through a valuation prism—dividend yield or price-earnings ratio, for instance. That’s certainly a useful adjustment, but let’s not abandon raw return just yet. As researchers at AQR Capital Management have noted (“Value and Momentum Everywhere”), rolling five-year return is a useful proxy for accounting-based valuation metrics.
Why consider unadjusted performance for estimating valuation? Several reasons, starting with timely signals. Waiting for earnings data, which can be revised, takes time whereas market estimates print in real time. In addition, return-based estimates of valuation for mean-reversion analysis can be applied across asset classes for work in a portfolio setting. That’s especially useful when valuation metrics aren’t readily available or missing altogether.
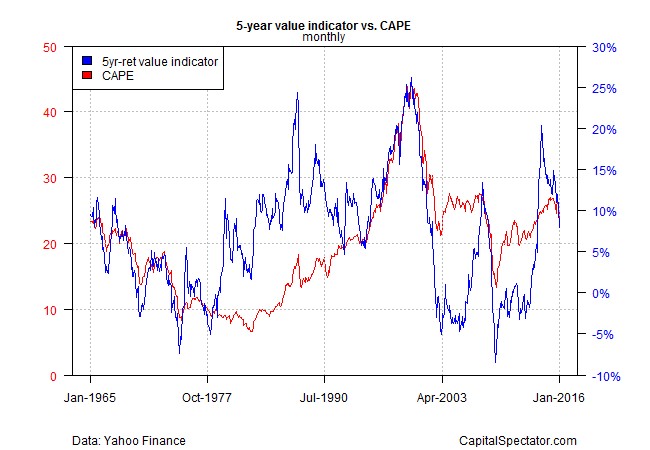
How does return-based valuation compare with traditional methods? As a quick test, let’s compare rolling 5-year return to Professor Robert Shiller’s widely followed CAPE–cyclically adjusted price-to-earnings ratio–for the S&P 500. As you can see in the chart below, the two metrics share a degree of similarity at times, but it’s far from a perfect match. Nonetheless, there are periods when the two are in tight agreement. When the twain shall meet, ye signal may be more compelling. (Note that 5-year return data in the chart is monthly to match CAPE’s frequency).
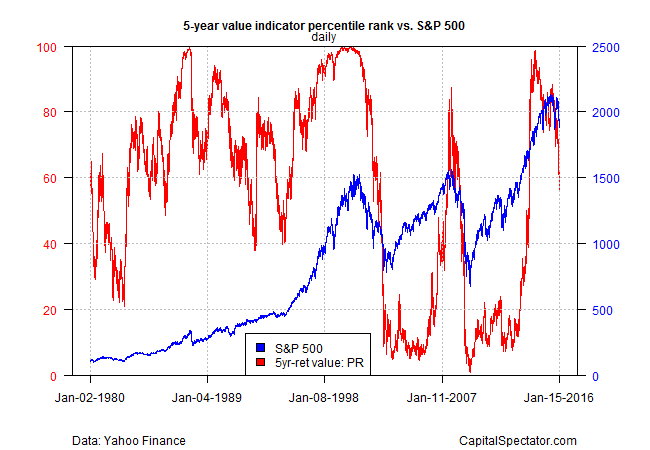
The extremes of high valuation via 5-year rolling return are easier to see and arguably more useful if we transform the performance data into percentile rank. The next chart shows that 5-year return’s percentile rank tends to rise into the upper quintile near the stock market’s major peaks in recent years.
There’s no shortage of caveats here. For starters, valuation by any measure is rarely a short cut to quick profits. As the old saw goes, the market can stay irrational for longer than you can stay solvent.
That brings up another key point: valuation and mean-regression modeling work best as part of a diversified toolkit for risk-management analysis (see, for example, the markets-based return proxy for value via the Crash Risk Index).
The main exception: you have a Warren Buffett-like time horizon (and skill set), in which case you may have the wherewithal to focus on the value factor in isolation as a means for getting rich slowly.
The larger point is that mean reversion is useful, despite what you may have heard elsewhere. It’s hardly foolproof, but it’s a crucial source of investment intelligence—in all its various guises—for developing perspective on market cycles. It should rarely if ever be the last word for managing asset allocation and rebalancing. But ignoring this information is no less short-sighted.
Thank you! Do the concerns described in the contemporaneous post
https://blogs.cfainstitute.org/investor/2016/01/19/dumb-alpha-the-drawbacks-of-compound-interest/
become relevant when only when you need to forecast returns based on the value indicator?
Pingback: Mean Reversion in Asset Returns
Gary,
Yes, estimation uncertainty is a humbling factor in all cases of forecasting, and it’s no less relevant for mean reversion. The main solution as I see it (and it’s only a partial solution) is to use several methodologies to estimate expected return. If and when you see a degree of confirmation via estimates from different models, the implication is that the forecast error band has narrowed a bit. For instance, the recent slide in risk premium estimates for US equities to under 4% via an equilibrium methodology — http://www.capitalspectator.com/risk-premia-forecasts-major-asset-classes-5-january-2016 — jibes with some of the forecasts I’ve seen based on the dividend discount model. That’s a clue for thinking maybe, just maybe, those estimates are robust.
–JP