It’s a melt-up scenario. Everything’s running higher for the major asset classes. Red ink has been banished from our standard list of ETF proxies via 250-trading-day windows (the rough equivalent of 1-year returns). With volatility generally moving in the opposite direction, it’s the best of times as summer’s set to officially begin on Saturday.
US stocks (VTI) continue to hold the lead, with a strong 26.3% gain for the trailing 250-day trading period through June 18. In close pursuit: foreign developed market equities (VEA) with a 25.4% surge. Emerging-market stocks (VWO), recently battered, have since revived, moving this slice of the world’s equity markets up to third place with a 21.5% increase. Even the bottom performer is now in the black: inflation-indexed Treasuries (TIP): higher by 3.7% over the past 250 trading days.

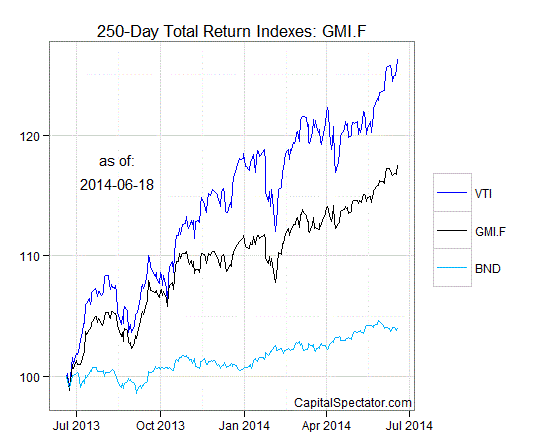
For a graphical recap, consider the relative performance histories for each of the major asset classes for the past 250 trading days by way of the ETF proxies. The chart below shows the performance records through June 18, 2014, with all the ETFs rebased to 100 using a start date of June 20, 2013:

Now let’s review an ETF-based version of an unmanaged, market-value-weighted mix of all the major asset classes–the Global Market Index Fund, or GMI.F, which is comprised of all the ETFs in the table above. Here’s how GMI.F stacks up for the past 250 trading days through June 18, 2014. This investable strategy has climbed 17.6% over that time frame, or roughly midway between the returns for US stocks (VTI) and US bonds (BND).
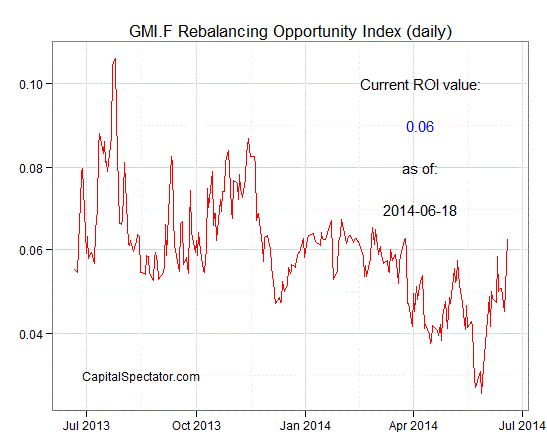
Comparing the overall dispersion of returns for the major asset classes via ETFs suggests that the rebalancing opportunity is improving for GMI.F vs. recent history. Indeed, thanks to the generally wider array of 250-day returns for all the ETF proxies lately, the performance spread for these funds has turned higher. Analyzing the components of GMI.F with a rolling median absolute deviation of one-year returns for the ETFs–the GMI.F Rebalancing Opportunity Index, as it’s labeled on these pages–suggests that there’s relatively greater potential generally for adding value by reweighting this portfolio in comparison with recent weeks. Keep in mind that the opportunity for productive rebalancing will vary depending on the choice of holdings and historical time window. Meantime, don’t overlook the possibility that any given pair of ETFs may present a substantially greater or lesser degree of rebalancing opportunity vs. analyzing GMI.F’s components collectively.
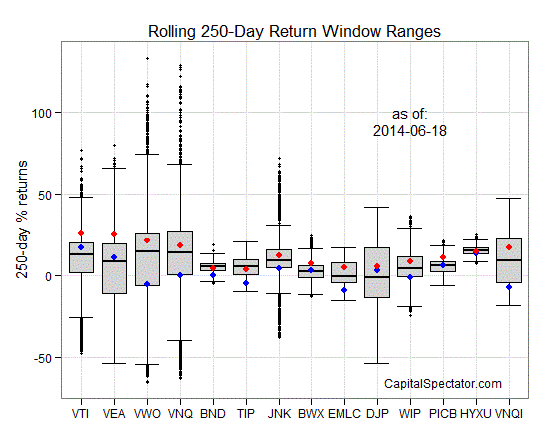
Finally, let’s compare the rolling 1-year returns (250-trading-day performance) for the ETFs in GMI.F via boxplots for a revealing comparison of price momentum. The gray boxes in the chart below reflect the middle range of historical 250-day returns for each ETF—i.e., the 25th to 75th return percentiles. The red dots show the current return (as of June 18) vs. the 250-day return from 30 trading days earlier (blue dots, which may be hiding behind the red dots in some cases). What’s clear is that the current 250-day return is above the comparable return from 30 days ago–for all the ETFs. Positive momentum, in short, has the upper hand… for now.
The ETF Asset Class Performance Review, which offers a deeper look
at an ETF-based view of asset classes. For more information and a
recent sample, see CapitalSpectator.com/premium.