Searching for value can be a profitable strategy, but patience is usually required, sometimes in industrial-level doses. Consider today’s update of The Capital Spectator’s semi-regular deep-value fishing expedition, as seen through an ETF lens. While there’s no shortage of battered funds to contemplate, that was true in previous updates and the deepest shades of red reflect a list that’s not all that different from recent rankings.
Notably, commodities still dominate in the land of pummeled assets, along with a handful of emerging market nations and currencies that have taken a hit.
Before we dive into the details, let’s recap the house rules for identifying funds that could be strong candidates for relatively high expected returns by virtue of comparatively hefty trailing losses. The metric of choice for deep value is the 5-year return, via an idea outlined in a paper by AQR Capital Management’s Cliff Asness and two co-authors: “Value and Momentum Everywhere,” which was published in a 2013 issue of the Journal of Finance. There are many value metrics and so no one should confuse the 5-year-performance benchmark as the last word in the search for bargain-priced assets. But we have to start somewhere and this is as good as any launching pad.
Learn To Use R For Portfolio Analysis
Quantitative Investment Portfolio Analytics In R:
An Introduction To R For Modeling Portfolio Risk and Return
By James Picerno
One reason for using 5-year performance: it can be applied across a wide set of assets, thereby offering a level playing field for evaluating value far and wide. It doesn’t hurt that this measure is simple and therefore immune to estimation risk, which can complicate accounting-based value gauges, such as price-to-book and price-to-earnings measures. In short, 5-year results are a useful tool as a first approximation for locating ETFs that appear to be deeply discounted by the crowd — a condition that implies that expected returns are relatively high a la the value proposition for investing.
Keep in mind that the standard caveat applies, namely: there can be no guarantee that value, however you define it, will lead to superior performance anytime soon, if ever. With that advisory aside, ranking a broad sweep of assets through a 5-year-return window provides useful perspective on global-market trends in recent history.
The ranking below covers 135 exchange-traded products that run the gamut: US and foreign stocks, bonds, real estate, commodities and currencies. (You can find the full list here, sorted in ascending order by annualized 5-year return — 1260 trading days — through yesterday’s close, June 27).
Note that the list is quite granular. In equities, for instance, the ETFs range from broad regional definitions (Asia, Latin America, etc,) to country funds, down to US sectors (energy, financials, for instance) and industries (e.g., oil & gas equipment & services). The only restriction is what’s available for US exchange-listed funds. Also, one representative ETF for each market niche is selected, albeit subjectively, and so there’s only one fund in the list for US real estate investment trusts, for example. Otherwise, the search is broad and deep, or as broad and deep as permitted given the current availability of US-listed ETFs.
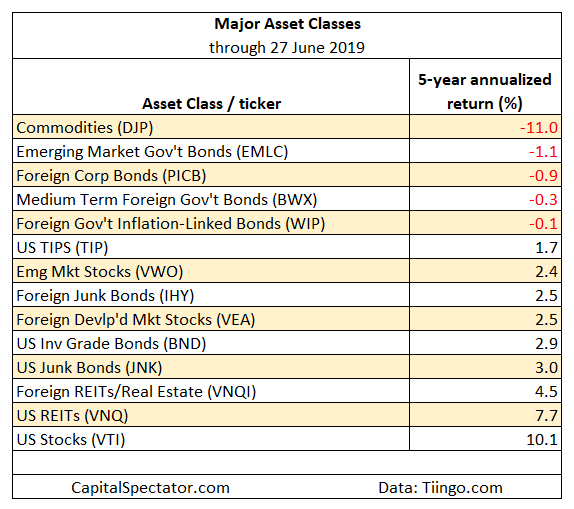
With the housekeeping issues aside, let’s move on to the numbers, starting with the major asset classes for a big-picture profile. Echoing recent updates, a broad definition of commodities is still the weakest performer by far. The iPath Bloomberg Commodity (DJP) – an exchange-trade note – has shed an annualized 11.0% on a trailing 5-year basis — a performance that’s essentially unchanged from the previous update in April. The second-deepest five-year annualized loss is a relatively slight 1.1% decline in foreign bonds issued by governments in emerging markets via VanEck Vectors J.P. Morgan EM Local Currency Bond (EMLC). Excluding commodities, foreign bonds generally continue to post the biggest 5-year losses for the major asset classes.
Now let’s consider the full list of funds, focusing on the deepest 20 losses for all 135 ETFs. The biggest decline (still) is natural gas: United States Natural Gas (UNG) has lost nearly 28% a year over the past five years. For equities, the deepest loss is currently held by Global X MSCI Greece (GREK), which has tumbled by an annualized 14.4% a year. The biggest setback in the US equities space: SPDR S&P Oil & Gas Equipment & Services (XES) is down by an annualized 27.0% over the past five years. XES, by the way, is also nursing the second-deepest loss for all the ETFs.

Finally, let’s consider how the other half is faring: the strongest five-year performance is currently held by SPDR S&P Semiconductor (XSD), which has soared an annualized 18.4%. A contrarian’s paradise for shorting? Maybe, but beware: XSD was the top performer in the April update. The more things change…
Is Recession Risk Rising? Monitor the outlook with a subscription to:
The US Business Cycle Risk Report
Pingback: Searching for Value - TradingGods.net