The US economy is widely expected to post modestly faster growth in this year’s first quarter vs. the weak 1.0% GDP rise in last year’s Q4 (based on seasonally adjusted annual rates). The projected improvement still looks unimpressive, but the good news is that analysts continue to forecast a slightly faster expansion for the “advance” Q1 GDP report that the Bureau of Economic Analysis will publish on Apr. 28.
One of the more optimistic estimates (as of Mar. 18) comes from BMO Capital Markets, which predicts a 2.3% rise in Q1 GDP—more than double the rate in last year’s Q4. But that’s an outlier on the upside relative to the crowd’s view. The Wall Street Journal’s survey data for this month points to a 2.1% advance for first-quarter output, based on the average estimate for economists.

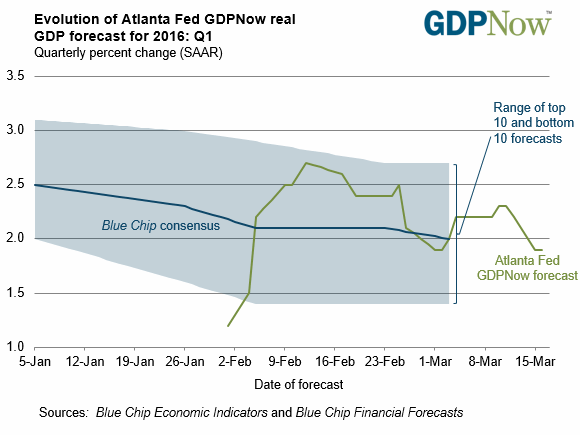
The Atlanta Fed’s GDPNow model is currently projecting Q1 growth of only 1.9% (as of Mar. 16), which reflects a modest downgrade relative to estimates in recent weeks. Meanwhile, The Capital Spectator’s average econometric estimate for Q1 is 1.5%. That’s fractionally above last month’s 1.4% estimate, but a tepid projection nonetheless.
Markit Economics yesterday advised that the weak survey numbers for US manufacturing in March, combined with a downturn in the services purchasing managers’ index (PMI) for February (the March update is due on Thursday), hints at weak growth generally. “The survey data are pointing to very modest GDP growth in the first quarter,” Markit’s chief economist, Chris Williamson, said. “Hopes are therefore pinned on a rise in Thursday’s services flash PMI for March to reassure that the economy is not completely stalling.”
Meantime, here are the various forecasts that are used to calculate CapitalSpectator.com’s average estimate:

As updated estimates are published, based on incoming economic data, the chart below tracks the changes in the evolution of The Capital Spectator’s projections.

Finally, here’s a brief profile for each of The Capital Spectator’s GDP forecast methodologies:
R-4: This estimate is based on a multiple regression in R of historical GDP data vs. quarterly changes for four key economic indicators: real personal consumption expenditures (or real retail sales for the current month until the PCE report is published), real personal income less government transfers, industrial production, and private non-farm payrolls. The model estimates the statistical relationships from the early 1970s to the present. The estimates are revised as new data is published.
R-10: This model also uses a multiple regression framework based on numbers dating to the early 1970s and updates the estimates as new data arrives. The methodology is identical to the 4-factor model above, except that R-10 uses additional factors—10 in all—to forecast GDP. In addition to the data quartet in the 4-factor model, the 10-factor forecast also incorporates the following six series: ISM Manufacturing PMI Composite Index, housing starts, initial jobless claims, the stock market (Wilshire 5000), crude oil prices (spot price for West Texas Intermediate), and the Treasury yield curve spread (10-year Note less 3-month T-bill).
ARIMA GDP: The econometric engine for this forecast is known as an autoregressive integrated moving average. This ARIMA model uses GDP’s history, dating from the early 1970s to the present, for anticipating the target quarter’s change. As the historical GDP data is revised, so too is the forecast, which is calculated in R via the “forecast” package, which optimizes the parameters based on the data set’s historical record.
ARIMA R-4: This model combines ARIMA estimates with regression analysis to project GDP data. The ARIMA R-4 model analyzes four historical data sets: real personal consumption expenditures, real personal income less government transfers, industrial production, and private non-farm payrolls. This model uses the historical relationships between those indicators and GDP for projections by filling in the missing data points in the current quarter with ARIMA estimates. As the indicators are updated, actual data replaces the ARIMA estimates and the forecast is recalculated.
VAR 4: This vector autoregression model uses four data series in search of interdependent relationships for estimating GDP. The historical data sets in the R-4 and ARIMA R-4 models noted above are also used in VAR-4, albeit with a different econometric engine. As new data is published, so too is the VAR-4 forecast. The data sets range from the early 1970s to the present, using the “vars” package in R to crunch the numbers.
ARIMA R-NIPA: The model uses an autoregressive integrated moving average to estimate future values of GDP based on the datasets of four primary categories of the national income and product accounts (NIPA): personal consumption expenditures, gross private domestic investment, net exports of goods and services, and government consumption expenditures and gross investment. The model uses historical data from the early 1970s to the present for anticipating the target quarter’s change. As the historical numbers are revised, so too is the estimate, which is calculated in R via the “forecast” package, which optimizes the parameters based on the data set’s historical record.
Pingback: US Economy Expected to Grow Modestly Faster