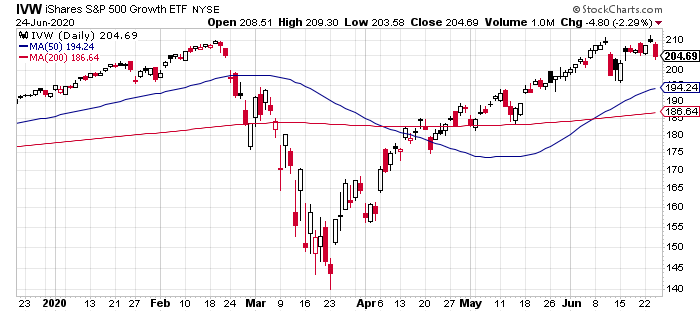
It’s a precarious leadership as a rebound in US coronavirus cases threaten to undermine the economic recovery, but for now it’s lonely at the top for growth and momentum as the lone equity factor strategies posting year-to-date gains, based on a set of exchange traded funds through June 24.
Large-cap growth in particular is the top performer this year in the factor realm. The iShares S&P 500 Growth (IVW) is up 6.3% in 2020. The fund has stalled in recent days after a sharp rebound from the coronavirus correction in March, but it’s far ahead of the rest of the field to date.

The only other year-to-date gainer: iShares Edge MSCI USA Momentum Factor (MTUM), which has posted a 3.0% year-to-date increase.
Learn To Use R For Portfolio Analysis
Quantitative Investment Portfolio Analytics In R:
An Introduction To R For Modeling Portfolio Risk and Return
By James Picerno
The remaining factor funds on our list remain in the red, a state of affairs that’s unchanged from earlier this month. The deepest year-to-date losses continue to be concentrated in small-cap and value stocks. The biggest decline so far in 2020: iShares Core S&P Small-Cap (IJR), which has shed a hefty 27.7%.

It’s telling that the market overall remains modestly in the red this year. Despite an impressive bounce after the March correction, SPDR S&P 500 (SPY) is still down 4.5% in 2020.
The prospects for a wider recovery for factor strategies looks challenged at the moment, thanks to new worries that coronavirus infections are regaining momentum in a number of states.
“The market has been optimistic that the economy is re-opening and that life would get somewhat back to normal, but the virus may have other ideas,” observes Chris Zaccarelli, chief investment officer at Independent Advisor Alliance.
The resurgence in Covid-19 cases coincides with signs that the US economic recovery may be stumbling. “We’re now starting to see very early evidence that things are leveling off” in some of the states that reopened early and are now reporting rising virus cases, advises Michelle Meyer, who heads US economics at Bank of America.
Profiling all the factor ETFs listed above still reflects a revival in animal spirits of late, based on two sets of moving averages. The first measure compares the 10-day average with its 100-day counterpart — a proxy for short-term trending behavior (red line in chart below). A second set of moving averages (50 and 200 days) represent an intermediate measure of the trend (blue line). Note, however, that the improvement in the pricing trend has been mostly due to a recovery in short-term momentum (red line). Meanwhile, the longer-term momentum measure (blue line) has yet to confirm the recent bounce.

How is recession risk evolving? Monitor the outlook with a subscription to:
The US Business Cycle Risk Report
Pingback: Rebound in Coronavirus Cases Threatens to Undermine Economic Recovery - TradingGods.net
Pingback: This Week’s Best Investing Articles, Research, Podcasts 6/26/2020 - Stock Screener - The Acquirer's Multiple®