The recent increase in junk bond yields is a warning sign that recession risk is rising, says Martin Fridson, a money manager at Lehmann Livian Fridson Advisors. “I am not an economic forecaster — this is what the market is saying,” he told Bloomberg on Tuesday. “There are lots and lots of caveats, but if you accept all of the assumptions, it’s a pretty startling comment,” says this respected veteran of all things high-yield-bond related.
Fridson’s methodology for estimating recession risk via junk bonds is summarized as follows via the Bloomberg article:
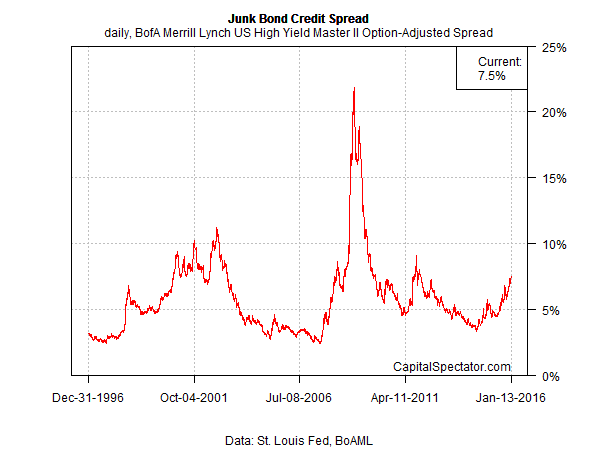
Fridson’s analysis looks at monthly junk-bond spreads since 1986, using Bank of America Merrill Lynch index data. The extra 7.39 percentage points investors demanded to hold high-yield debt over Treasuries on Jan. 8 was somewhat less than midway between the 5.2 percentage point-average for expansionary months and 10.19 percentage point-average for recessionary months. That signals the probability of a recession at 43.9 percent, according to the Tuesday report from Standard & Poor’s Capital IQ Leveraged Commentary & Data.
Let’s run a data check with a different approach for estimating recession risk using junk bonds, followed by a look at additional indicators from elsewhere in the markets and the economy. As a preview, the signals suggest that business-cycle risk is elevated relative to levels in recent years but still well short of a clear tipping point in terms of estimating probabilities for an NBER-defined recession.
First, here’s how the raw high-yield spread stacks up at the moment through yesterday (Jan. 13) via the BofA Merrill Lynch US High Yield Master II Option-Adjusted Spread. Yesterday’s 7.50% spread reading is the highest since late-2011 but far below–so far–the heights reached in the last recession.
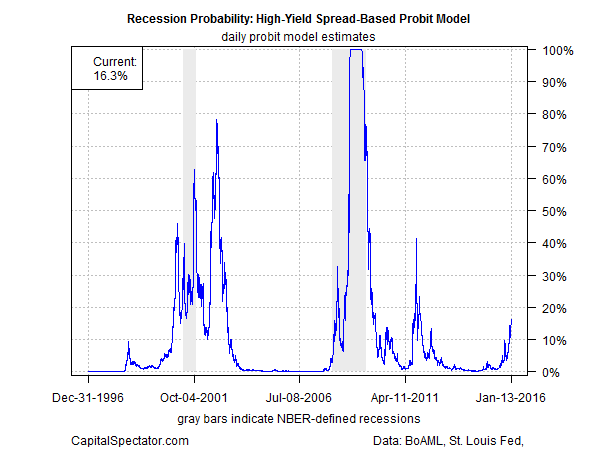
Crunching the numbers in a probit model and analyzing the results in context with NBER’s business cycle history estimates the current probability of recession at roughly 16%. That’s the highest since 2011, but it’s still low enough to refrain from announcing that a new downturn is fate. Nonetheless, it’s clear that the numbers are moving in the wrong direction these days.
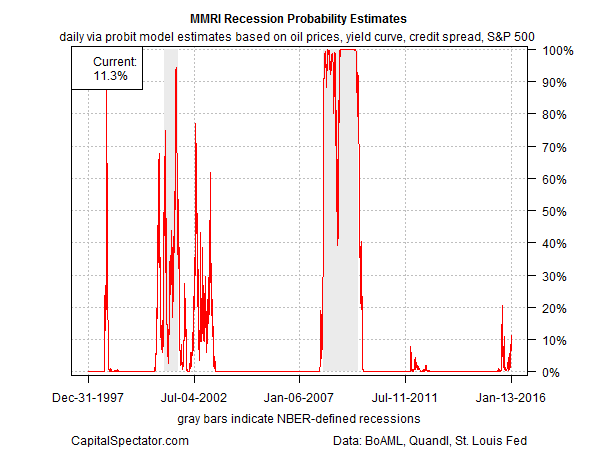
Keep in mind that it’s always dangerous to use one indicator to estimate recession risk. No data set is flawless and statistical noise is everywhere. Accordingly, it’s essential to review a broad set of indicators to develop robust estimates of the current state of the business cycle. For real-time analysis we can start with the markets, but there’s no reason to look solely at junk bonds. Let’s add the US stock market, the Treasury yield curve, and spot prices for crude oil to the junk spread for a moderately more reliable measure of economic risk—the Macro-Market Risk Index (MMRI), as it’s labeled on these pages. Using a probit model to estimate recession probabilities in context with NBER’s business-cycle database tells us that the current risk via this four-factor benchmark is still quite low—around 11%.
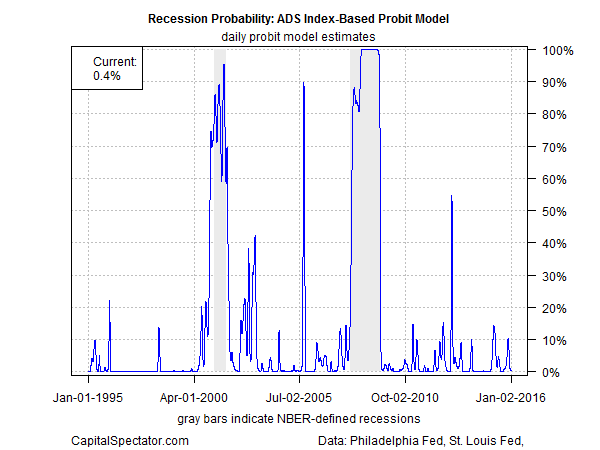
Markets alone can only tell us so much about the real economy. For deeper perspective we should also look at the economic numbers proper—employment, personal income, etc. A good starting point is the Philly Fed’s ADS Index, which offers a quasi-real-time measure of business-cycle conditions. The current update for the index, with numbers for the real economy available through Jan. 2, translates into a recession risk probability that’s virtually nil.
Low recession risk is also the message in the current readings of the Chicago Fed’s National Activity Index (3-mo. avg.) and The Capital Spectator’s proprietary benchmarks. The caveat here is that both index sets, because they’re tracking economic indicators, are monthly and arrive with a lag, as per the nature of the underlying releases, i.e., payrolls, industrial production, and so on.
In other words, the age-old trade-off of timeliness vs. accuracy is in play. Market data is available in real time and immune to revision. The price tag is that these numbers are subject to a higher degree of noise in the context of economic analysis. By contrast, the official macro data offer a clearer and generally more reliable profile of business cycle trends, but at the cost of a publishing lag and the possibility of revision down the road. The solution: routine analysis of both side of this coin, in isolation and in aggregated form. (Comprehensive updates, by the way, are available in The US Business Cycle Risk Report if you’re looking for a systematic review of the signals.)
As for the current situation, the markets are signaling that recession risk is moderately higher but not yet at the critical tipping point. Meanwhile, the current set of economic indicators continue to point to low recession risk overall.
With that in mind, there are two key questions for the days and weeks ahead. First, will we see even darker signals in the markets? If so, will the rising risk embedded in the crowd’s outlook spill over into the economic indicators proper?
For the moment, the overall reading for the US economy is that the probability is low that a new recession has started, based on the data published to date. Depending on where you look, the threat looks elevated, but it’s unclear if the isolated signals are noise or a genuine warning. That’s par for the course for real-time analysis in periods when economic growth is wobbly, as it is now. Meantime, the standard advice applies: Assume that economic growth will endure until we see compelling evidence that tells us otherwise.
By that standard, cautious optimism on the US macro outlook remains a reasonable view. We’re seeing turbulence in some corners–manufacturing, in particular. But for the moment the broad trend is still positive. Growth is sluggish, however, so this is no time to fall asleep at the switch. In short, the standard qualification applies: the current analysis isn’t written in stone.