The long-running bull market in bonds continues to defy bearish forecasts, as shown by a set of exchange-traded funds. Positive year-to-date performance in all the major corners of fixed income continues to offer a stark counterpoint to analysts who expect trouble.
Long-term corporate bonds continue to lead the field by a wide margin for 2019 results. Vanguard Long-Term Corporate Bond (VCLT) is up 20.9% for the year through yesterday’s close (Oct. 15). The gain far outpaces the broad investment-grade benchmark for US fixed income via Vanguard Total Bond Market (BND), which is ahead by 8.3% this year.
Although VCLT is the clear leader in 2019, all the main slices of the US fixed-income market are posting gains—including five market subsets enjoying performance in excess of 10% this year.
Is Recession Risk Rising? Monitor the outlook with a subscription to:
The US Business Cycle Risk Report
Despite the bull run, worries persist. Bank of America Securities, for example, warns that the bond market’s exuberance casts a shadow over a staple asset allocation benchmark: the 60/40 portfolio (60% stocks, 40% bonds). “There are good reasons to reconsider the role of bonds in your portfolio,” and raise the equity weight, advises a research note from the bank. “The relationship between asset classes has changed so much that many investors now buy equities not for future growth but for current income, and buy bonds to participate in price rallies,” write portfolio strategists Derek Harris and Jared Woodard.

In a summary of the research, MarketWatch notes:
As global economic growth slows and the population in developed-market economies ages, traditionally safer assets like bonds have grown in popularity and helped create a “bubble” in the bond market that threatens to derail returns for investors who maintain a typical 60-40 split, according to the BofA analysis.
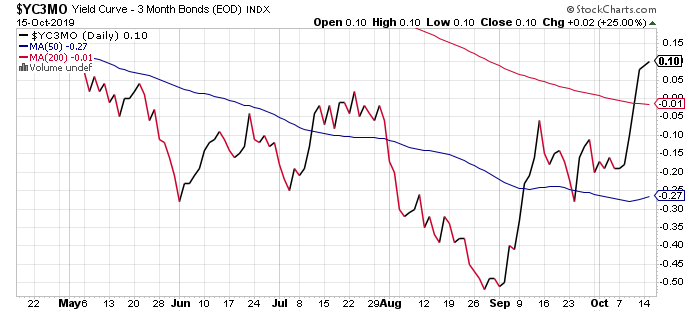
Pessimists point to the return of a positive Treasury yield curve for the 10-year/3-month spread as a possible sign that the tide is turning. This widely followed slice of the yield curve has been inverted (short rates above long rates) for most of recent history since the spring. Over the past three trading sessions, however, the curve is positive again, if only slightly.
But there’s still plenty of debate about whether the bond rally has hit a wall. The bulls point out that the Federal Reserve is still expected to cut interest rates again, potentially offering fresh support for supporting if not lifting bond prices further. Fed funds futures are pricing in a roughly 78% probability that the central bank will announce another cut at the Oct. 30 FOMC meeting.
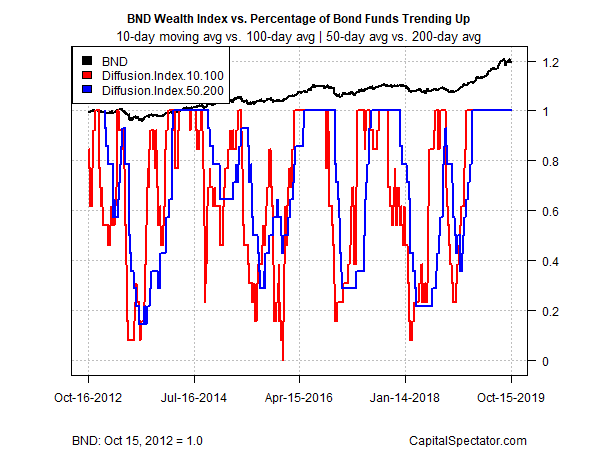
Meantime, all the bond ETFs listed above continue to post bullish price momentum, based on a set of moving averages. The first metric compares each ETF’s 10-day moving average with the 100-day average — a proxy for short-term trending behavior (red line in chart below). A second set of moving averages (50 and 200 days) offers an intermediate measure of the trend (blue line). The indexes range from 0 (all funds trending down) to 1.0 (all funds trending up). Despite the perceived risks for bonds, all the bond ETFs cited continue to reflect a bullish price trend. Trouble may be lurking, but for the moment the crowd is pricing the bond market for perfection.
Learn To Use R For Portfolio Analysis
Quantitative Investment Portfolio Analytics In R:
An Introduction To R For Modeling Portfolio Risk and Return
By James Picerno
Pingback: Long-Running Bull Market in Bonds Continues - TradingGods.net