The first half of 2016 has been a rocky road for the US economy, but the macro trend has muddled through and continues to post growth that appears to be strong enough to avoid a new recession. The main sources for keeping the expansion alive: job growth and consumer spending.
Although year-over-year red ink continues to infect several indicators, a number key employment indicators, including payrolls, have remained firmly in the positive column. Consumer spending has also stayed positive, albeit after a wobbly period earlier in the year, which now appears to be giving way to a slight rebound. After dipping to a thin 0.8% annual rise in March, real retail sales have posted modestly higher gains in recent months.
Stronger growth is expected to show up in next week’s “advance” estimate of second-quarter GDP. Yesterday’s update (July 19) of the Atlanta Fed’s GDPNow model projects 2.4% growth in Q2. That’s still a modest gain, but it’s also twice as strong as Q1’s weak 1.1% rise. The New York Fed’s current nowcast (July 15) is a bit softer at 2.2% for Q2, but here too the outlook calls an encouraging if unspectacular revival after the disappointing kick-off to 2016.
As long as the relatively positive trends for consumer spending and employment endure, the negative comparisons elsewhere on the macro landscape probably won’t pull the US economy into a contraction. It’s a precarious balance, but for the moment it’s not obvious that the moderate upside bias is about to give way. In fact, near-term projections for the macro trend hint at the possibility of slightly stronger growth, as noted below.
Meantime, reviewing the data published to date shows that the broad trend continues to reflect growth that’s strong enough to keep an NBER-defined recession at bay as of June. The strength of the expansion has decelerated vs. 2015, but last month’s momentum was still firm enough to main output in the plus column overall. The analysis is based on a methodology outlined in Nowcasting The Business Cycle: A Practical Guide For Spotting Business Cycle Peaks. The Economic Trend and Momentum indices (ETI and EMI, respectively) have fallen in recent months but remain at levels that still equate with growth, albeit at a relatively slow rate. Here’s a summary of recent activity for the components of ETI and EMI:
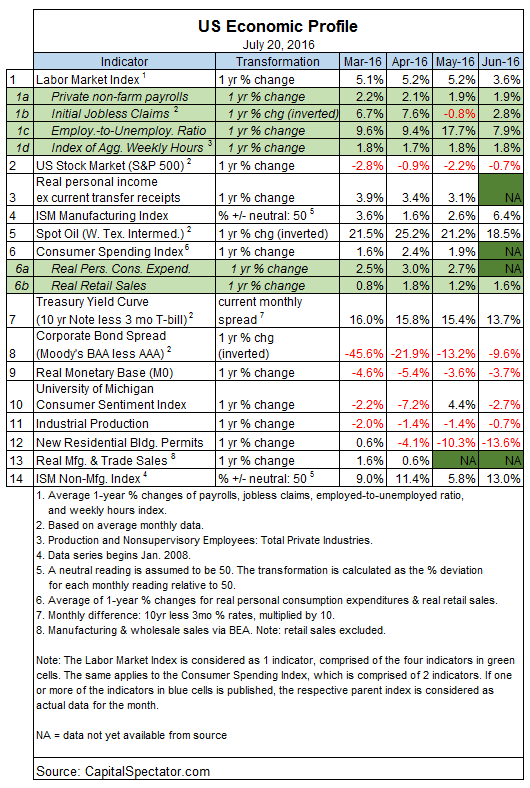
Aggregating the current data in the table above into business cycle indexes reflects weaker but still positive trends overall. The latest numbers for ETI and EMI show that both benchmarks are above their respective danger zones: 50% for ETI and 0% for EMI. The margin of comfort with current readings vs. the tipping points, however, has become quite thin, highlighting the possibility for trouble, depending on how the incoming numbers compared. When or if the indexes fall below the tipping points, we’ll have clear warning signs that recession risk is at a critical level and a new downturn is likely. (See note at the end of this post for ETI/EMI design rules.)
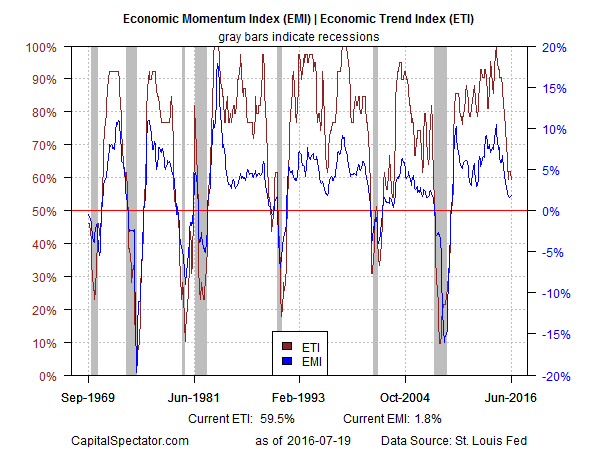
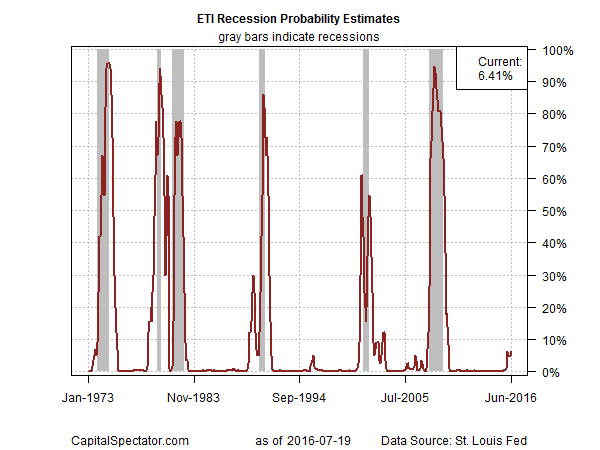
Translating ETI’s historical values into recession-risk probabilities via a probit model also points to low business-cycle risk for the US through last month. Analyzing the data with this methodology shows a slight uptick in risk lately, but the numbers still imply that the odds are low that the National Bureau of Economic Research (NBER) — the official arbiter of US business cycle dates— will declare June as the start of a new recession.
For some perspective on looking ahead, consider how ETI may evolve as new data is published. One way to project future values for this index is with an econometric technique known as an autoregressive integrated moving average (ARIMA) model, based on calculations via the “forecast” package for R, a statistical software environment. The ARIMA model calculates the missing data points for each indicator, for each month–in this case through August 2016. (Note that April 2016 is currently the latest month with a complete set of published data.) Based on today’s projections, ETI is expected to remain above its danger zone for the near term by holding above the 50% mark. (Keep in mind that business cycle updates are available on a weekly basis in The US Business Cycle Risk Report.)
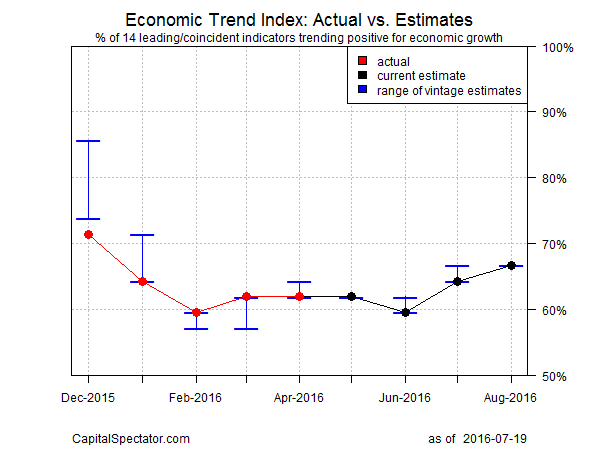
Forecasts are always suspect, of course, but recent projections of ETI for the near-term future have proven to be relatively reliable guesstimates vs. the full set of published numbers that followed. That’s not surprising, given the broadly diversified nature of ETI. Predicting individual components, by contrast, is prone to far more uncertainty. The current projections (the four black dots on the right in the chart above) suggest that the economy will continue to expand. The chart above also includes the range of vintage ETI projections published on these pages in previous months (blue bars), which you can compare with the actual data that followed, based on current numbers (red dots). The assumption here is that while any one forecast for a given indicator will likely miss the mark, the errors may cancel out to some degree by aggregating a broad set of predictions. That’s a reasonable view according to the historical record for the ETI forecasts.
For additional perspective on judging the track record of the forecasts, here are the previous updates for the last three months:
20 Jun 2016
18 May 2016
20 Apr 2016
Note: ETI is a diffusion index (i.e., an index that tracks the proportion of components with positive values) for the 14 leading/coincident indicators listed in the table above. ETI values reflect the 3-month average of the transformation rules defined in the table. EMI measures the same set of indicators/transformation rules based on the 3-month average of the median monthly percentage change for the 14 indicators. For purposes of filling in the missing data points in recent history and projecting ETI and EMI values, the missing data points are estimated with an ARIMA model.
Pingback: Growth Appears Strong Enough to Avoid a Recession - TradingGods.net