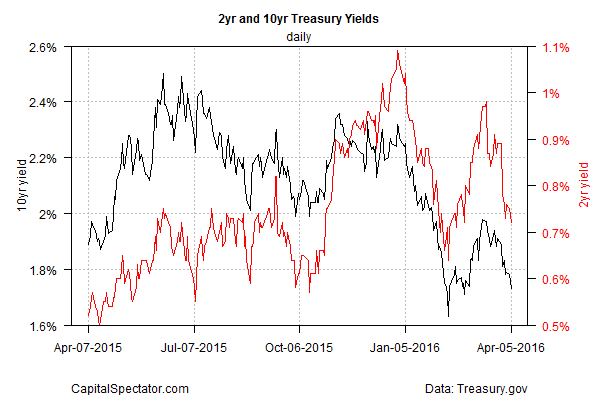
The risk-off trade is back in high gear, according to Treasury yields. The downside momentum in the benchmark 10-year yield is particularly conspicuous, based on daily data through yesterday (Apr. 5) via Treasury.gov. One theory making the rounds: the slide in the 10-year yield to 1.73% on Tuesday — a five-week low — is the crowd’s way of pricing in expectations that the first estimate of US GDP growth for this year’s first quarter that’s due later this month will slip to the slowest pace in two years.
The Atlanta Fed yesterday downgraded the outlook for the “advance” Q1 GDP report to a tepid 0.4% rise (seasonally adjusted annual rate) via the bank’s widely followed GDPNow model. If the estimate is correct, the quarterly increase for the economy in this year’s first three months will slow sharply from the already sluggish 1.4% rise in last year’s Q4. In other words, the GDP report that’s due on Apr. 28 will mark the slowest quarterly gain since the 0.9% slide in 2014’s Q1.
Meantime, the 10-year yield is caught up in a slide of its own lately. As a result, yesterday’s dip to 1.73% suggests that we may see the benchmark rate move below the Feb. 11 yield of 1.63%, which marked a four-year low.
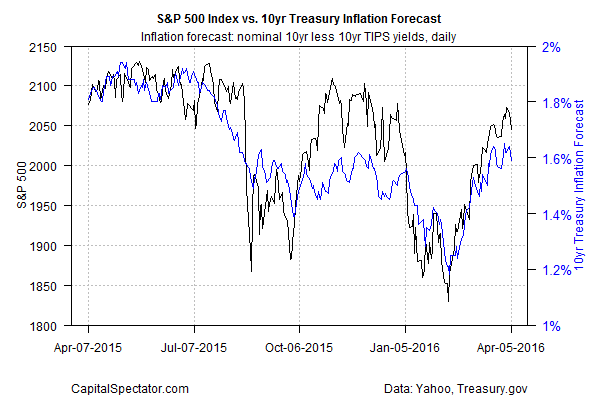
Not surprisingly, the Treasury market’s inflation expectations are showing signs of peaking after rebounding in recent months. The implied inflation rate via 10-year maturities—nominal less inflation-indexed yields—eased to 1.59% yesterday. That’s still a moderately higher level vs. the 1.20% range in early February. But the question now, given the revival of downside momentum in yields generally (and expectations for a stall-speed GDP report): Is the Treasury’s inflation forecast headed lower? If the answer is “yes,” the US stock market may be set for a new stumble.

Note the tight connection between the S&P 500 and the 10-year Treasury’s implied inflation outlook over the past year in the next chart below. For instance, the equity market’s sharp rebound during the past two months has been accompanied by a comparable revival in the 10-year inflation forecast. But if inflation expectations are set to slide, recent history suggests that the change in sentiment may take a toll on equity prices.
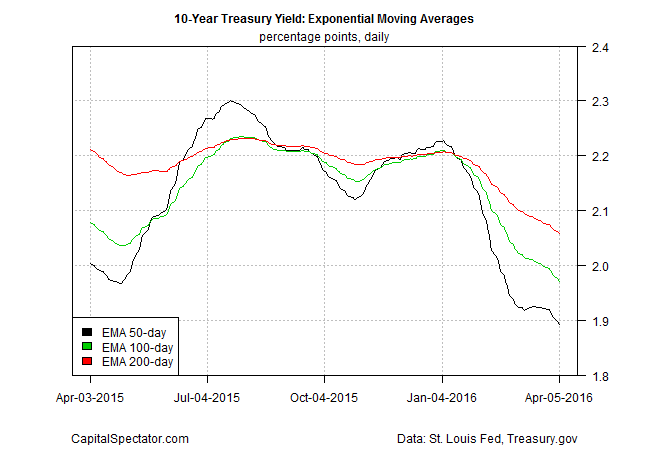
That leaves us with the challenge of deciding if interest rates—the benchmark 10-year yield in particular—are headed lower. All the usual caveats apply when it comes to forecasting rates, but downside momentum for the 10-year yield appears set to roll on for the near-term future, based on a set of exponential moving averages (EMAs) for this maturity. As you can see in the next chart, the 50-day EMA is below the 100-day EMA, which is under the 200-day EMA. That’s a bearish pattern for the yield outlook, which suggests that the stock market will remain under pressure too.
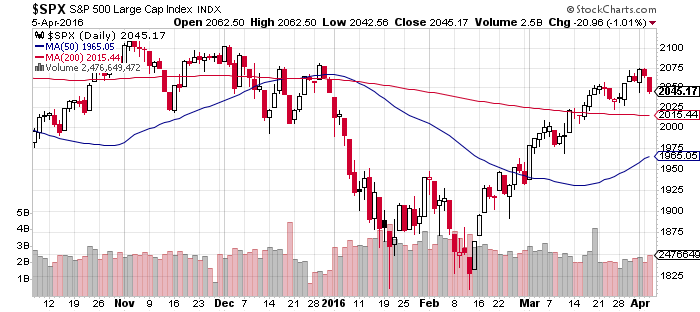
Adding to the burden for expecting US equities to rally is the S&P’s inability to climb above the previous high that was set at the end of 2015. For the moment, we’re looking at a rally that fell short of the old peak. Not a productive sign. Anything’s possible, of course, but for the moment it’s a bit tougher to bet against the risk-off trade.
Pingback: Falling Treasury Yields Could Create Headwind for US Equities - TradingGods.net
Pingback: 04/06/16 – Wednesday’s Interest-ing Reads | Compound Interest-ing!