In the coming weeks you’ll see a new forecasting methodology rolled into the economic previews that routinely appear on The Capital Spectator (see here, for instance). As a brief introduction, let’s consider a real world example by crunching the numbers for tomorrow’s estimate of US private payrolls from ADP.
The new model is based on combining forecasts with a technique known as triangular distributions, which require only three inputs: minimal, maximal and “most likely” or modal values (HT: Michael Helbraun at Revolution Analytics). Here’s how Wikipedia explains the rationale for using this technique for estimating future values of a time series:
The triangular distribution is typically used as a subjective description of a population for which there is only limited sample data, and especially in cases where the relationship between variables is known but data is scarce (possibly because of the high cost of collection). It is based on a knowledge of the minimum and maximum and an “inspired guess” as to the modal value. For these reasons, the triangle distribution has been called a “lack of knowledge” distribution.
As for combining forecasts, the inspiration flows from a long line of research that tells us that aggregating predictions tends to be more reliable than the individual estimates. This is old news (the formal research on the topic dates to at least 1969 by way of the widely cited Bates and Granger paper), but it’s no less relevant in the 21st century in the perennial job of managing uncertainty. As Allan Timmermann noted in a 2005 study: “Forecast combinations have frequently been found in empirical studies to produce better forecasts on average than methods based on the ex-ante best individual forecasting model.”
Adding triangular distributions (TDs) to the mix offers a bit more control in managing the uncertainty that infects predictions. Because TDs draw on a different set of assumptions and techniques vs. the other models used on these pages, the average forecast is, in theory, slightly more robust in a statistical sense.
The approach here starts with using Econoday.com’s consensus forecast for the data set under scrutiny (in this case tomorrow’s ADP report) as the proxy for the “most likely” value. The minimal and maximal values are represented by the outer extremes of each survey’s forecasts. For today’s ADP projection, the Econoday/TD-based estimate is combined with three additional forecasts via econometric techniques that are standard tools in the economic previews on these pages: an autoregressive integrated moving average (ARIMA) model, an exponential smoothing model, and a vector autoregression model. In each case, the point forecast is used to represent the “most likely” value, with the upper and lower numbers for the 95% confidence intervals representing the minimal and maximal values.
With the data sets in hand, we then run a Monte Carlo simulation on the combined forecasts and generate 1 million data points on each forecast series to estimate a triangular distribution. (The econometric engine here is the “triangle” package that’s run in R.) Finally, we take random samples from each of the four simulated data sets and use the expected value with the highest frequency as our prediction.
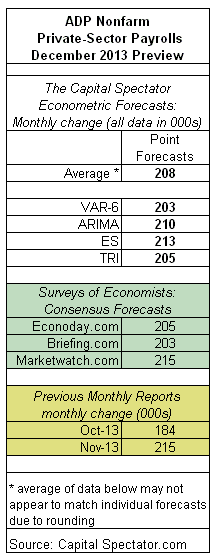
The results are show below, with the triangular distribution forecast indicated by “TRI”. Taking the average of all four estimates tells us that tomorrow’s December ADP employment report is projected to show a 208,000 gain for private payrolls over the previous month. That’s a bit less than November’s 215,000 rise, but moderately higher than we’ve seen in recent history. Meanwhile, the Capital Spectator’s average 208,000 projection is in the middle of a trio of consensus forecasts for December via surveys of economists:
VAR-6: A vector autoregression model that analyzes six economic time series in context with the ADP private payroll employment. The six additional series: the ISM Manufacturing Index, industrial production, index of weekly hours worked, US stock market (S&P 500), spot oil prices, and the Treasury yield spread (10 year Note less 3-month T-bill). The forecasts are run in R with the “vars” package.
ARIMA: An autoregressive integrated moving average model that analyzes the historical record of the ADP private payroll employment in R via the “forecast” package.
ES: An exponential smoothing model that analyzes the historical record of the ADP private payroll employment data in R via the “forecast” package.
