All the US equity sectors have bounced off the Mar. 23 broad-market low, with consumer discretionary shares leading the way, based on a set of exchange traded funds through yesterday’s close (Oct. 12). Technology is a close second. On both fronts, the rallies have carried prices well above the broad market’s recovery since the depth of the coronavirus crash in late-March.
Consumer Discretionary Select Sector SPDR (XLY) continues to post the strongest return so far in the post-crash revival. The ETF is up a red-hot 78.7% since the market’s darkest hour at Mar. 23’s close. Powered by top holdings including Amazon (AMZN) and Home Depot (HD), XLY ended at a record high in yesterday’s trading session.
In close pursuit is Technology Select Sector SPDR (XLK), which is up 74.6% from the Mar. 23 bottom.
Learn To Use R For Portfolio Analysis
Quantitative Investment Portfolio Analytics In R:
An Introduction To R For Modeling Portfolio Risk and Return
By James Picerno
Energy stocks are posting the weakest recovery. Although Energy Select Sector SPDR (XLE) surged early on after the broad market bottomed in late-March, the fund has stumbled in recent months and is currently up a comparatively modest 25.6% since Mar. 23.

The US stock market overall, based on SPDR S&P 500 (SPY), is ahead 55.3% since the coronavirus-crash low. SPY’s bounce leads seven of the 11 sector returns for that period.

A key factor that’s been keeping stocks bubbly lately is the prospect that a new round of federal economic stimulus is in the works. Although negotiations between Republicans and Democrats have kept a breakthrough on ice for months amid tortured debates, some analysts predict that a second coronavirus relief bill will arrive at some point.
“The market has come to a realization that stimulus is going to be coming … no matter who is the president,” says Robert Pavlik, chief investment strategist and senior portfolio manager at SlateStone Wealth LLC. “It’s probably going to be coming about a month out from now,” after the Nov. 3 election.
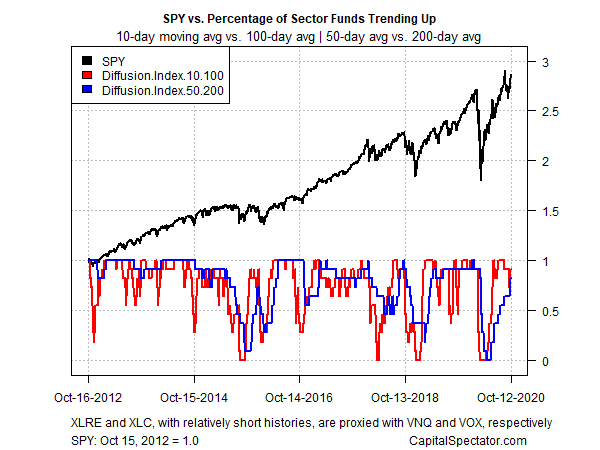
Ranking all the sector funds through a momentum lens reveals that most of the ETFs in this space are posting bullish profiles, based on two sets of moving averages. The first measure compares the 10-day average with its 100-day counterpart — a proxy for short-term trending behavior (red line in chart below). A second set of moving averages (50 and 200 days) represent an intermediate measure of the trend (blue line). Data through yesterday’s close shows that bullish short-term momentum continues to prevail for the majority of sector funds.

How is recession risk evolving? Monitor the outlook with a subscription to:
The US Business Cycle Risk Report
Pingback: Consumer Discretionary Shares Leading the Way in US Equity Sectors - TradingGods.net