Markets rebounded in April following the selloff in March. In some cases, you have to squint to see a recovery, but April’s gains were broad, lifting all the major asset classes to some degree, based on results for a set of ETFs.
US stocks led the way. The Vanguard Total US Stock Market ETF (VTI) surged 10.4% last month. The rally left US equities comfortably in the black year to date, with a 6.0% advance.
Stocks in emerging markets (VWO) and US real estate investment trusts (VNQ) were the second- and third-best performers last month. The weakest increase in April came from US bonds (BND), which edged up a thin 0.1%.
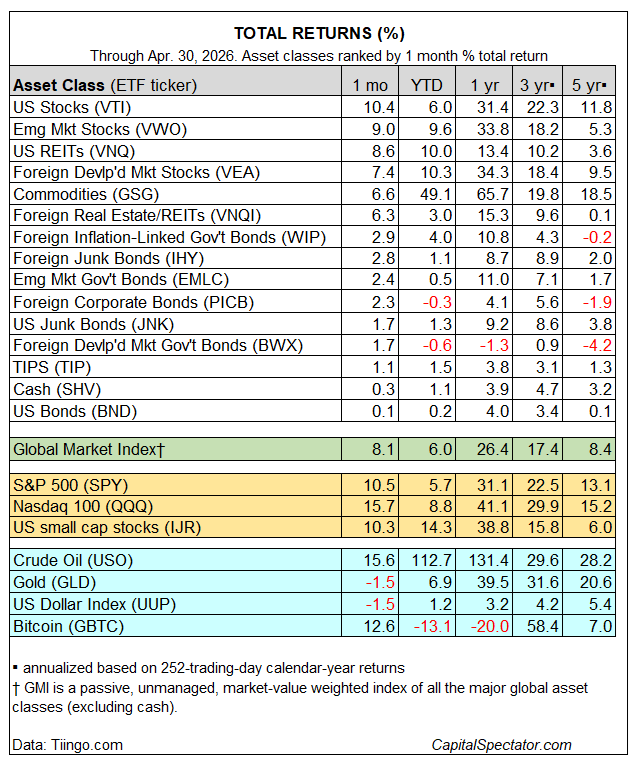
Commodities (GSG) extended their rally, rising for a fourth straight month, propelled by turmoil in the Middle East that has raised energy costs. Gold (GLD), however, didn’t participate, and edged down 1.5%.
Year to date, nearly every slice of global markets is posting an advance through April’s close. The downside exceptions: foreign corporate bonds (PICB), government bonds in developed markets ex-US (BWX), and bitcoin (GBTC).
The Global Market Index (GMI) recovered its losses from the previous month, jumping to a new record high in April. GMI is an unmanaged benchmark (maintained by The Capital Spectator) that holds all the major asset classes (except cash) in market-value weights via ETFs and serves as a competitive benchmark for globally diversified, multi-asset-class portfolio strategies.
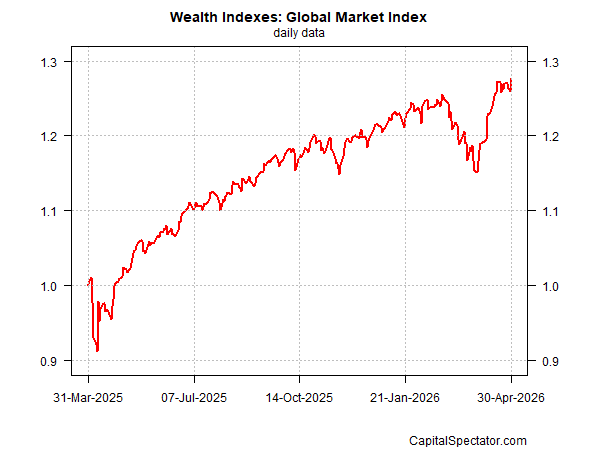
GMI rallied 8.1% last month and is now up 6.0% for the year to date. It has enjoyed a strong winning streak over the past year, advancing in 12 of the past 13 months—its strongest bull run in a decade.

Here are the official inflation rates used for the matching periods (with 3-year and 5-year rates annualized, consistent with the table’s methodology):
1 Month (Feb 2026 – Mar 2026): 1.05% *
YTD (Dec 2025 – Mar 2026): 1.90%
1 Year (Mar 2025 – Mar 2026): 3.26%
3 Year (Mar 2023 – Mar 2026 annualized): 3.04%
5 Year (Mar 2021 – Mar 2026 annualized): 4.51%
You cab subtract these inflation rates from the total returns to calculate the real (inflation-adjusted) returns.
*Since the official April 2026 Consumer Price Index (CPI) report is scheduled for release on May 12, 2026, the latest available official inflation data is for March 2026. I have used the U.S. Bureau of Labor Statistics’ official CPI-U data ending in March 2026 to act as the best proxy for these periods.