Maintaining a bullish outlook on markets has become an emotionally challenging affair in recent history, but the crowd continues to look through the constant flow of troubling news and concludes that it’s still reasonable to stay the course. Informed or not, that sentiment has been a winning strategy so far, and remains on display in several sets of ETF pairs that track key market segments through yesterday’s close (June 11).
From a global asset‑allocation perspective, an aggressive strategy (AOA) relative to its conservative counterpart (AOK) offers a useful starting point. This broad-based measure of sentiment weakened in the early weeks of the war with Iran but has since recovered and continues to point to a risk‑on bias.
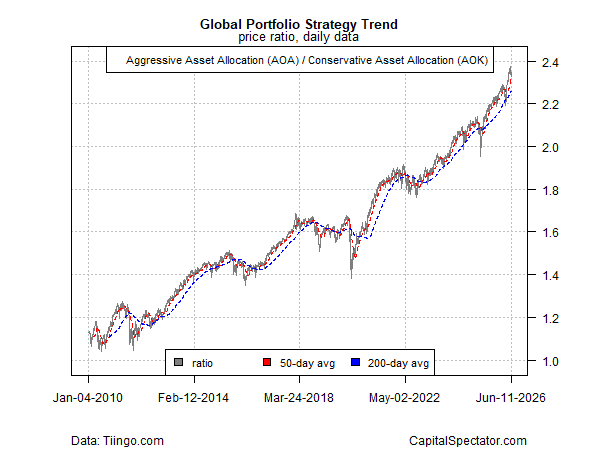
Using the 50‑day/200‑day moving averages as a guide for the AOA:AOK ratio has successfully minimized much of the noise in recent years, albeit with some glaring exceptions. During the correction associated with the tariff tantrum in the spring of 2025, for example, a risk‑off signal was triggered, which ultimately proved to be a false alarm. Since then, this indicator has remained risk‑on as a big‑picture guide, supporting the case for looking through the recent chaotic news flow.
The key takeaway: monitoring metrics such as AOA:AOK, while hardly flawless, are useful starting point for evaluating sentiment, and asking the question: Is there a strong case for betting against the crowd?
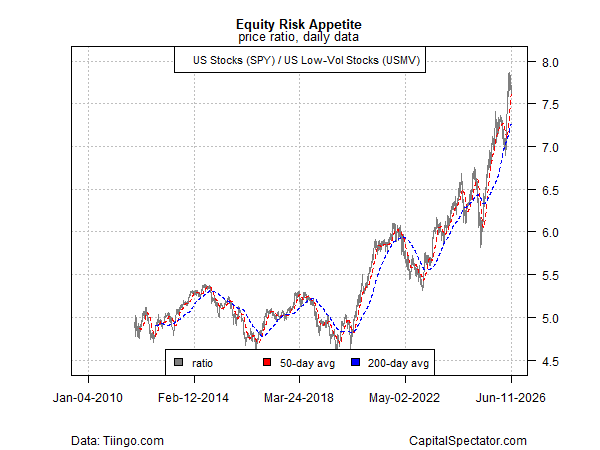
Similarly, monitoring a broad measure of U.S. stocks (SPY) versus a low‑volatility counterpart (USMV)—a proxy for a relatively conservative equity portfolio—shows a continued risk‑on posture this year via the 50‑/200‑day ratio, albeit one that has pulled back from its recent peak.
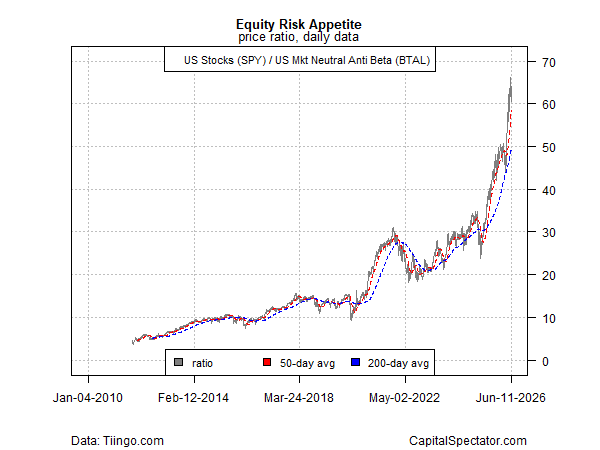
Several other measures of the U.S. equity market reflect even stronger risk‑on signaling, including the comparison between the broad equities market (SPY) and a defensive strategy based on a so‑called market‑neutral anti‑beta fund (BTAL).
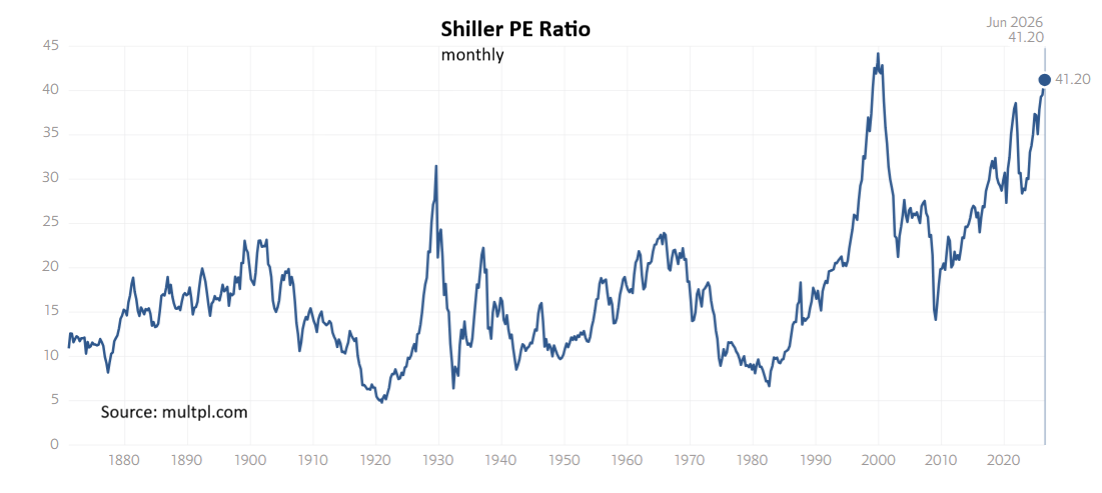
Skeptics of the risk‑on environment can rightly point to several reasons for caution, including high valuations. The Shiller PE ratio, for example, is approaching a record high, implying that the expected return for the U.S. stock market is relatively low.
But trend—however irrational it may appear—isn’t easily dismissed as a forward‑looking indicator. Contrarians argue otherwise, but the track record of trend‑based signals continues to compare favorably—by a wide margin—against bearish forecasts from a variety of models. How long this lasts is unknown, but the odds still seem to favor trend.

“constant flow of troubling news” is a bad take. And a giveaway.
Forest Felvey,
It is a “giveaway,” and that’s why the news flow is so troubling: the current situation is extremely worrisome.
–JP