Today’s update on housing starts and new building permits is wobbly while data on industrial output looks mildly encouraging. It’s going to take time to figure out which side of this macro coin is the genuine article, but in the meantime let’s zero in on the key trends as a starting point for guesstimating how the broad trend is unfolding.
Continue reading
US Industrial Production: December 2013 Preview
US industrial production in December is projected to increase by 0.4% vs. the previous month in tomorrow’s release from the Federal Reserve, according to The Capital Spectator’s median econometric forecast. The projected gain represents a sharp deceleration vs. the previously reported 1.1% rise for November. Meanwhile, the Capital Spectator’s median projection for December is slightly higher than three consensus forecasts based on recent surveys of economists.
Continue reading
US Housing Starts: December 2013 Preview
Housing starts are expected to total 1.023 million in tomorrow’s update for December, based on The Capital Spectator’s median econometric forecast (seasonally adjusted annual rate). The projection represents a modest decline vs. the previously reported 1.091 million for November. Meanwhile, the Capital Spectator’s median estimate for December is above a trio of consensus estimates based on recent surveys of economists.
Continue reading
Jobless Claims Fell Again Last Week
New filings for unemployment benefits inched lower last week, dropping for the second week in a row. The decline of 2,000 to a seasonally adjusted 326,000 for the week through January 11 is a welcome sign, of course. But the trend looks a bit sluggish lately, raising questions about the potential for stronger growth in the labor market in the months ahead.
Continue reading
US Equities: Performance Review | 16 Jan 2014
The US stock market continues to set new highs, but the bull market in equities comes in a variety of flavors. Yes, prices are higher across the board, but there’s a fair amount of variation to the party. The implication: the opportunity to add value with rebalancing within the equity allocation is knocking. Before we open the door, let’s take a peek at the possibilities by carving up US stocks into three buckets based on market capitalization, style (value vs. growth), and sectors. Our tour guides: a set of ETFs based on the trailing 250-trading-day total return (roughly the equivalent of 1-year performance).
Continue reading
Macro-Markets Risk Index: 12.0% | 1.15.2013
The US economic trend has been relatively stable and positive in recent weeks, based on a markets-based profile of macro conditions. The Macro-Markets Risk Index (MMRI) closed at 12.0% on Tuesday, January 14–a level that suggests that business cycle risk remains low. The current 12.0% value is well above the lowest reading in recent history (7.5% in mid-September 2013). More importantly, the current 12.0% value far exceeds the 0% danger zone. If MMRI falls under 0%, that would be a sign that recession risk is elevated. By contrast, readings above 0% imply that the markets are anticipating/forecasting economic growth.
MMRI represents a subset of the Economic Trend & Momentum indices, a pair benchmarks that track the economy’s broad trend for signs of major turning points in the business cycle via a diversified set of indicators. Analyzing the market-price components separately offers a real-time approximation of macro conditions, according to the “wisdom of the crowd.” Why look at market data for insight into economic conditions? Timely signals. Conventional economic reports are published with a time lag. MMRI is intended for use as a supplement for developing perspective on the current month’s economic profile until a complete data set is published.
MMRI measures the daily median change of four indicators based on the following calculations:
• US stocks (S&P 500), 250-trading day % change, plotted daily
• Credit spread (BofA ML US High Yield Master II Option-Adjusted Spread), inverted 250-trading day % change, plotted daily
• Treasury yield curve (10-yr Treasury yield less 3-month T-bill yield), no transformation, plotted daily
• Oil prices (iPath S&P GSCI Crude Oil Total Return Index ETN (OIL)), inverted 250-trading day % change, plotted daily
Here’s how MMRI compares on a daily basis since August 2007:
Here’s a review of how MMRI stacks up over the past 12 months:
Retail Sales Up A Mild 0.2% In December
Retail sales rose again last month–the ninth consecutive month of higher spending. But December’s advance was the slowest since September. The headline figure was pulled down by a sizable slump in auto sales. Excluding motor vehicles, retail spending advanced 0.7% in December over the previous month. Looking past the monthly noise, the broad trend via the year-over-year comparison reveals that moderate growth prevails.
For perspective, let’s start with the monthly numbers. As the first chart shows, December spending turned sluggish vs. October and November. Excluding gasoline sales, retail sales posted the slowest monthly advance since March.
Turning to the annual view, however, suggests that nothing much has changed for retail spending. Consumption through December was higher by 4.1%, a touch lower than November’s 4.2% gain. It’s fair to say that retail spending remains stable at just over the 4% mark. That’s near the lower end of the annual rates of change we’ve seen in recent years and so there’s minimal room for disappointment going forward. But for now, the trend still looks mildly encouraging.
The bottom line: consumer spending isn’t a problem for the economy at this point. By contrast, the income side of personal finances looks a bit wobbly, as I discussed yesterday.
Ultimately, personal spending and income are bound at the hip. In the grand scheme of economic indicators, the tight connection between changes in one vs. the other is second to none in the land of highly correlated variables across, say, rolling one-year periods. With that in mind, today’s retail sales report implies that income-related stress is still minimal. If income suffers in the months ahead, the blowback will show up in various measures of consumer spending, but there’s no major sign of distress in the data du jour.
On that note, we’ll know more when the government publishes the December personal income data on January 31. Meantime, the broad trend for retail spending still looks mildly encouraging.
Asset Allocation & Rebalancing Review | 14 Jan 2014
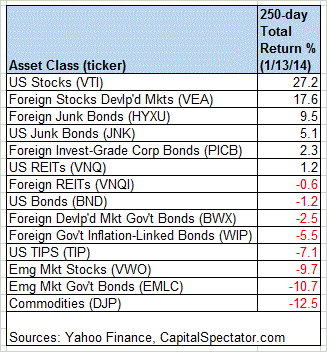
A new year has started, but the performance view for the major asset classes doesn’t look all that different from the final days of the old year, at least not yet. Let’s consider how the numbers stack up with a set of ETF proxies using a 250-trading-day window. By that standard, US equities are still in the lead, although the performance edge has weakened a bit. Meanwhile, there’s still plenty of red ink at the opposite end of the return spectrum.
Stocks in these United States are up more than 27% through yesterday, January 13, based on the Vanguard Total Stock Market ETF (VTI). At the far end of the losing side of the ledger: a broad measure of commodities, as tracked by the iPath DJ-UBS Commodity ETN (DJP).
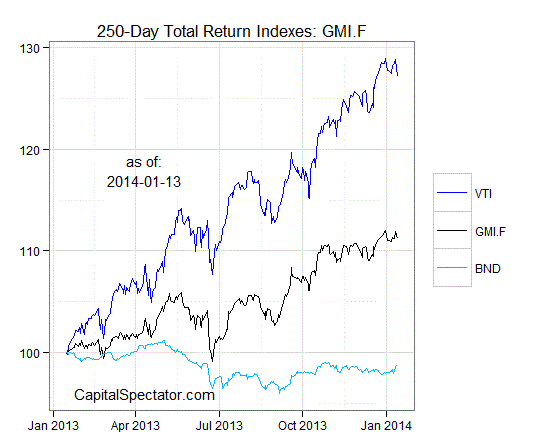
For another perspective, let’s graph the return histories for each of the major asset classes for the past 250 trading days. The next chart shows the performance records through January 13, 2014, with all the ETFs rebased to 100 as of January 15, 2013:
Now let’s review an ETF-based version of a passive, market-value-weighted mix of all the major asset classes–the Global Market Index Fund, or GMI.F, which is comprised of the ETFs in the table above. Here’s how GMI.F stacks up for the past 250 trading days through January 13, 2014. This investable strategy is higher by 11% over that span, or roughly midway between the returns for US stocks (VTI) and US bonds (BND) for the same period.
Comparing the overall dispersion of returns for the major asset classes via ETFs suggests that the rebalancing opportunity is relatively middling for GMI.F vs. recent history. Analyzing the components of GMI.F with the rolling median absolute deviation of one-year returns for all the funds–the GMI.F Rebalancing Opportunity Index, as it’s labeled on these pages–suggests that there’s average potential for adding value by reweighting the portfolio in comparison with the past several weeks.
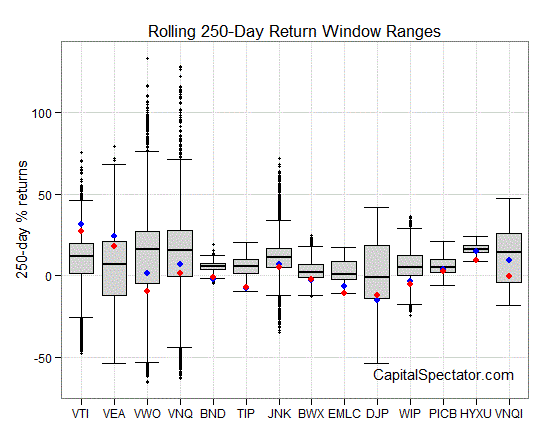
Finally, let’s compare the rolling 1-year returns (defined here as 250-trading-day performance) for the ETFs in GMI.F via boxplots. (Keep in mind that the historical records for these ETFs vary due to different launch dates). The gray boxes in the chart below reflect the middle range of historical returns for each ETF—the 25th to 75th return percentiles. The red dots indicate the current 1-year return (as of Jan. 13) vs. the 1-year return from 30 trading days earlier (blue dots, which may be hiding behind the red dots in some cases). Note that US stocks (VTI) remain in the lead in absolute and relative terms vs. the other asset classes.
If you found the analysis above useful, consider the weekly updates via The ETF Asset Class Performance Review, which offers a deeper look at an ETF-based view of asset classes. For more information and a recent sample, see CapitalSpectator.com/premium.
US Retail Sales: December 2013 Preview
US retail sales are expected to rise 0.2% in tomorrow’s December report vs. the previous month, according to The Capital Spectator’s median econometric forecast. The prediction is substantially below the previously reported 0.7% increase for November. Meanwhile, the Capital Spectator’s median projection for December is above a trio of consensus estimates based on recent surveys of economists.
Here’s a closer look at the numbers, followed by brief definitions of the methodologies behind The Capital Spectator’s projections:
R-2: A linear regression model that analyzes two data series in context with retail sales: an index of weekly hours worked for production/nonsupervisory employees in private industries and the stock market (S&P 500). The historical relationship between the variables is applied to the more recently updated data to project retail sales. The computations are run in R.
ARIMA: An autoregressive integrated moving average model that analyzes the historical record of retail sales in R via the “forecast” package.
ES: An exponential smoothing model that analyzes the historical record of retail sales in R via the “forecast” package.
VAR-6: A vector autoregression model that analyzes six time series in context with retail sales. The six additional series: US private payrolls, industrial production, index of weekly hours worked for production/nonsupervisory employees in private industries, the stock market (S&P 500), disposable personal income, and personal consumption expenditures. The forecasts are calculated in R with the “vars” package.
TRI: A model that’s based on combining forecasts with a technique known as triangular distributions. The forecast combinations include the following projections: Econoday.com’s consensus forecast data and the four predictions generated by the models noted above, i.e., R-2, ARIMA, ES and VAR-6. The forecasts are run in R with the “triangle” package. For more information about TRI, see this post.
Is The Falling Rate Of Personal Income Growth A New Risk Factor?
Friday’s weak jobs report has taken some of the air out of the optimism balloon for the US macro outlook, but in the search for things to worry about I’m more inclined to focus on the discouraging trend of late with personal income. To be precise, the decelerating year-over-year change in personal income less transfer receipts (Social Security checks, for instance) is beginning to look troubling. It may turn out to be noise, as an earlier dip proved to be. But we’re again entering a phase when there’s minimal room for disappointing numbers with the monthly reports on personal income. The data on payrolls, by contrast, still looks relatively strong for the critical year-over-year comparisons.
I don’t want to overplay the potential for trouble with the personal income numbers, at least not yet. As Doug Short reminds, the quirks in the government’s calculation for income may be distorting the trend at the moment. Keep in mind that the statistical twists may get worse before they get better. Taken at face value, however, the 1.2% annual rise in real personal income less transfer receipts is sharply lower vs. previous months and so this indicator is running out of road.
Income growth, of course, is a bedrock for a healthy economy, particularly in the US, where consumer spending is such a big piece of economic activity. Given the soft data on this front lately, the next release of personal income numbers on January 31 deserve close attention. Unfortunately, year-end seasonal issues related to taxes and other complications may leave us no more the wiser about the true trend on this front.
The good news is that the economic data generally still looks encouraging. Moderate growth continues to prevail when we consider a broad spectrum of numbers, as last month’s US Economic Profile shows (I’ll publish an update next week). But the business cycle is constantly evolving. For the moment, the signs of distress remain in the minority. Some choose to point to the surprisingly weak jobs report for December, although it’s too early to let one number cast aspersions across a generally upbeat macro profile. The year-over-year trend in private employment continues to advance at near a 2% rate, or roughly the pace we’ve seen in recent history. For now, the soft December monthly increase appears to be an outlier event for payrolls.
Personal income, by contrast, looks darker via a sharply decelerating rate of year-over-year growth. But it’s going to take some time to decide if this is noise or a legitimate warning sign for the economy.
Meantime, the week ahead brings more context for deciding how the big picture is shaping up, starting with tomorrow’s December report on retail sales, followed by the weekly jobless claims report on Thursday, and a pair of key updates on Friday for December: industrial production and housing starts.
As usual, truth and clarity in matters of the economic trend arrive in a familiar pattern: drip, drip, drip.


