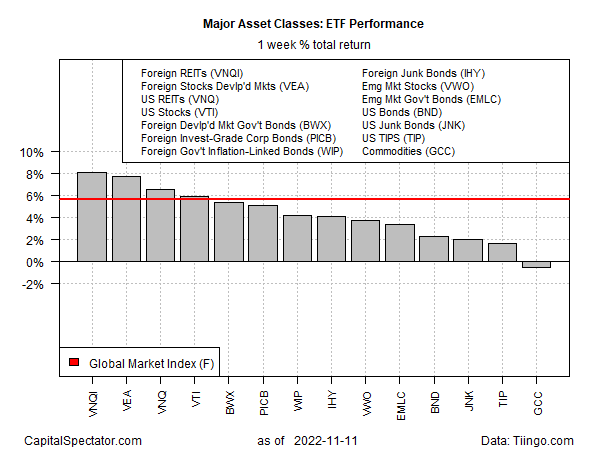
The major asset classes continued to recover in the trading week through Friday, Nov. 11, based on a set of ETF proxies. The lone exception: a broad measure of commodities.
Vanguard Global ex-US Real Estate (VNQI) led last week’s rallies by surging 8.1%. Despite the powerful gain, the ETF still reflects a deeply bearish trend and so it’s unclear if the latest bounce marks a bear-market bounce or the start of new bull run.

Property shares are prized for relatively high payout rates and so prices in this corner of risk assets are relatively sensitive to interest rate increases. On that score, there’s still a case for a cautious outlook. Although last week’s encouraging news on US inflation inspires expectations that the Federal Reserve will soon pause rate hikes, Fed Governor Chris Waller says monetary policy tightening isn’t over.
“We’ve got a long way to go to get inflation down unless by some miracle incomes start dropping off very rapidly, which I don’t think anybody expects,” he advises. “We’ve got to see this continue because the worst thing you can do is stop [tightening conditions] and then it takes off again, and you’re caught.”
Commodities posted the only setback last week for the major asset classes, edging down 0.5%. WisdomTree Enhanced Commodity Strategy Fund (GCC) continues to trade in a tight range after a summer sell-off.
The broad rally in markets lifted the Global Market Index (GMI.F), an unmanaged benchmark, maintained by CapitalSpectator.com. This index holds all the major asset classes (except cash) in market-value weights via ETFs and represents a competitive measure for multi-asset-class-portfolio strategies overall. GMI.F roared higher by 5.6% last week, the benchmark’s best weekly gain in 2-1/2 years (red line in chart below).

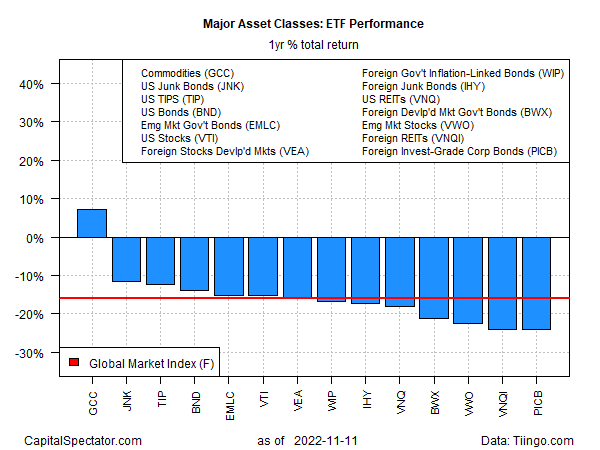
Despite last week’s powerful rallies, all the major asset classes remain under water for the trailing one-year window except for commodities (GCC).
GMI.F is also posting a one-year loss, closing down 16.0% vs. the year-earlier price.

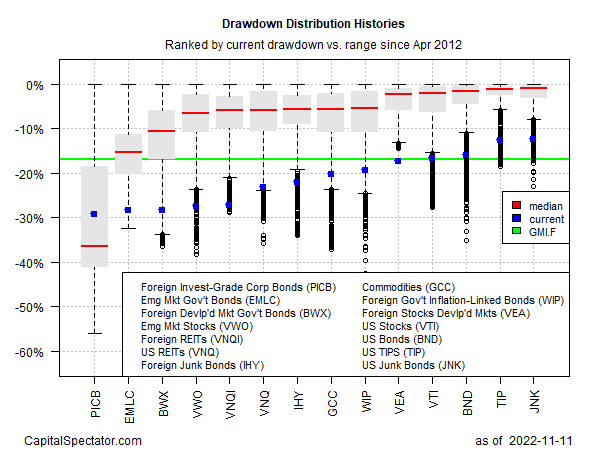
Reviewing the major asset classes through a drawdown lens continues to show steep declines from previous peaks. The softest drawdown at the end of last week: US junk bonds (JNK), which closed with a 12.4% peak-to-trough decline. The deepest drawdown: foreign corporate bonds (PICB), which ended the week with a 29.2% slide below its previous peak.
GMI.F’s drawdown: -16.9% (green line in chart below).

Learn To Use R For Portfolio Analysis
Quantitative Investment Portfolio Analytics In R:
An Introduction To R For Modeling Portfolio Risk and Return
By James Picerno