How much influence do investors have over their portfolios? Perhaps it’s less than commonly assumed. The notion that randomness plays a role in money management has been widely studied in finance–Nassim Taleb’s popular treatment in Fooled by Randomness: The Hidden Role of Chance in Life and in the Markets is one example. The concept is a staple in the money game, although it’s easily overlooked, even ignored in some cases. Consider a simple rebalancing strategy. Does it matter which dates you choose to return a portfolio mix back to the target weights? Maybe, but the details matter quite a lot in terms of the answer. For instance, crunching the numbers on an 11-fund portfolio with a Dec. 31, 2003 start date shows that randomly choosing rebalancing dates tends to perform as well if not better than a consistent year-end remix and a buy-and-hold strategy (based on daily data).
This is far from the final word on the subject, but the results from the test below show that for the years 2004-2015 (through Sep. 4) a random choice of 11 rebalancing dates (to match the number of year-end events for that period) delivered a surprisingly competitive/superior range of results for 1,000 portfolios. Surprising because quite a lot of attention and research has been directed over the years in looking for optimal rebalancing dates. But as we’ll see, it’s not clear that spending a lot of time searching for the best dates is a productive use of time and resources if your rebalancing system is a plain-vanilla design.
That doesn’t mean you shouldn’t rebalance. Rather, the analysis below suggests that moving heaven and earth in search of optimal rebalancing dates may be a waste of time for a basic portfolio set-up. The results also imply that in order to add value over a random choice of rebal dates, you’ll probably have to use a relatively sophisticated set of rules for asset allocation design and management.
Otherwise, let’s say that you’re planning on ten rebalancing events over the next decade as a risk-management system. Further, assume that the rebal events will simply move weights back to the target weights. It appears that randomly choosing ten dates over the coming decade for such a system is expected to do about as well, perhaps better, than a carefully designed system that’s focused on choosing the ten best dates in real time.
Is that a reason to embrace a tactical asset allocation design? In a future post I’ll look at how random rebalancing rules interact with a dynamic asset allocation system. Meantime, let’s review how random rebalancing dates compare with a buy-and-hold strategy and a year-end rebalancing system that returns the mix to preset target weights.
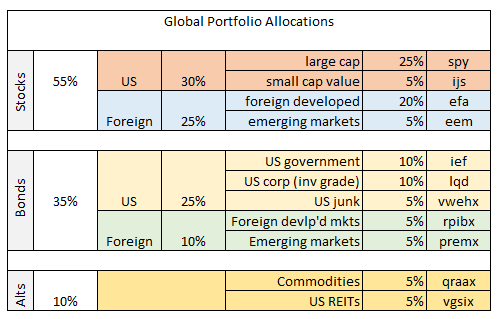
First, let’s define the test portfolio. The following is a twist on the 60/40 stock/bond mix. We’ll take five percentage points from each asset and reallocate to so-called alternatives: a broad-basket definition of commodities and real estate (US real estate investment trusts). For the remaining stocks and bonds, we’ll divide allocations into a more granular set of US and foreign allocations:
Note the mix of mutual funds and ETFs, which is necessary for a Dec. 31, 2003 start date–ETFs have a relatively limited history for such a broad mix. The limitation requires looking for alternative open-end products in search of sufficiently long track records for a backtest. In some cases there are superior funds available for building a portfolio today. But I’ve made some compromises in the interest of crunching the numbers with a single, continuous set of real-world performance histories for the sample period. Meanwhile, here’s the R code I wrote to analyze the data.
The backtest is simply choosing 1,000 random sets of 11 rebalancing dates that fall between Jan. 1, 2004 and Sep. 3, 2015. Why 11 dates? Because that matches the 11 year-end rebalancing events for the benchmark portfolio. For additional perspective, I’ve included a buy-and-hold portfolio that allows the market’s ebb and flow to manage the asset allocation.
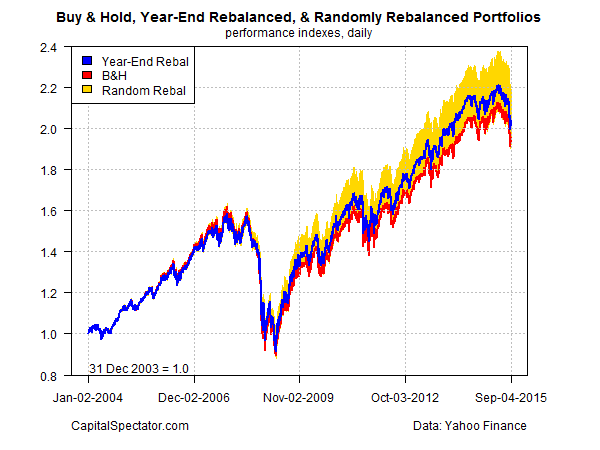
The results tell us that a year-end rebalancing regimen (blue line in chart below) delivered a moderately higher return over the sample period vs. a buy-and-hold strategy (red line). A $1 investment in a portfolio that reset the asset mix to the weights noted above at the end of each year grew to roughly $2.01 by last Friday (Sep. 4, 2015). By comparison, the buy-and-hold results were moderately lower, rising to around $1.93. Note too that the year-end rebalanced portfolio’s volatility (standard deviation of daily returns) was 6% lower relative to the buy-and-hold portfolio.
As for the 1,000 randomly rebalanced portfolios (shown by the gold performance band in the chart), the results were quite good. The worst performance more or less tracked the buy-and-hold strategy; the best performer raised an initial $1 investment to $2.16 by the end of the sample period. Notably, most of the random returns exceeded the year-end strategy’s results.
The basic message: rebalancing is a valuable tool for generating superior risk-adjusted performance. But it seems that tapping into this value-added service doesn’t require a lot of intellectual firepower for a standard asset allocation strategy. Letting a monkey choose the rebalancing dates over a period of years works as well if not better than automatically rebalancing at the end of each year.
To be fair, it’s possible that a more sophisticated system for choosing rebalancing dates could do better–adding a momentum filtering system, for instance. It’s also possible that applying this test to a different period of time—and/or a different set of funds–would produce different results. In future posts, I’ll explore how variations on the theme tested above compares.
Meanwhile, the results above suggest that many (most?) of the impressive performance records for multi-asset class portfolios over the past decade or so may be due to dumb luck. There’s nothing wrong with that, although trying to pass it off as a great intellectual achievement falls under the heading of fooled (scammed) by randomness.


Pingback: Investors and the Influence on Their Portfolios
James , going through your code I encourage you to have a look at the immensely useful package “qmao” (https://r-forge.r-project.org/R/?group_id=1113) from Garrett See. ‘qmao’ is an addon to the ‘quantmod’ package. Lines 18 – 34 for instance, can be replaced by a single line using the ‘makeReturnFrame’ function (or it’s alias RF)’ which merges prices/returns from several symbols ! (http://www.rdocumentation.org/packages/qmao/functions/PF) . Regards Helmuth
Helmuth,
Thanks for the tip. I’ll check it out. Seems like there’s always another improvement to learn about when it comes to coding in R.
–JP
Pingback: Quantocracy's Daily Wrap for 09/08/2015 | Quantocracy
Pretty interesting as usual, thanks for sharing.
p.s. Could you share on github the code for the chart as well? I’m curious how you get to the yellow shaded area referred to the 1000 sims.
Best,
RR
Richard,
My charting efforts are proprietary, in part because creating good graphics can be tougher than generating the underlying analytics. Meantime, for consulting (and somewhat self-serving) purposes, I’d rather not give away all the hard-learned secrets in public. The code for the chart I posted is in fact quite messy–R’s base code isn’t all that user friendly for charting, although ggplot is better. In any case, the coding acrobatics that’s required to make everything look pretty isn’t something I’m ready to share. Apologies. That said, as a basic setup you can use matplot() on the port.all file to graph everything. Alternatively, you can play around with matplot(rand.sample.data.1) to see the random plots, followed by par(new=T) plot() on port.global.bh$wealthindex and par(new=T) for port.global.dec31rebal$wealthindex to add the BH and rebal strategies. Note that in the example I plotted on the web site the gold-colored random portfolios seem to fuse together because there’s 1,000 data sets. Individually, however, these are distinct lines.
–JP
It seems to me that rebalancing when allocations stray beyond some predetermined boundaries would be the most effective. Rebalancing essentially takes advantage of the mean reversion phenomena and doing it when the portfolio reaches some optimal point should be more effective than some random or predetermined time period. Any thoughts or research on this idea?
Thanks
Rob,
Point taken. There are many productive possibilities for designing a rebalancing strategy, but one that relies on randomly selected dates isn’t one of them. That said, this post was simply an exercise in demonstrating that searching for the optimal dates is probably futile. The good news, as you suggest, is that looking to other variables offers more traction for making informed decisions. Setting up weight bands for assets and rebalancing when those outer limits are breached is one of several intriguing idea with a degree of empirical support.
–JP
Pingback: 09/14/15 – Monday’s Interest-ing Reads | Compound Interest-ing!
No worries James, much appreciated your reply anyway.
I was just curious since, as you know better than me, R for charting is quite powerful, but not necessarily straight forward. Will work on your tips and keep up the amazing work.
Best,
Richard
James,
Thanks for sharing your research.
I agree about the key takeaway: Virtually any rebalancing strategy will capitalize on mean reversion. This assumes, of course, that no asset class montonically declines or goes to zero (e.g., buying Russia just before the revolution in 1917).
Time Frame for Buy-and-Hold
I’m surprised that random rebalancing beats a buy-and-hold: I had thought that allowing the weighting in stocks to “drift” upwards would have boosted the performance of buy-and-hold strategies during the period tested. My impression was that long-term returns for the portfolio would be boosted by simply letting your “winners ride,” and not cutting stocks back to the target asset allocation. This leaves the portfolio with a progressively higher weighting in stocks, which beat other asset classes over time horizons of 20 years or longer.
Either my thinking is wrong or I had a different time frame in mind.
Portfolios in Distribution
You mention that volatility for the rebalanced portfolios was 6% lower than for the buy-and-hold portfolio. Managing volatility is a critical issue for retirees seeking lifetime income. Volatility drag and sequence-of-returns risk is a killer for portfolios in distribution.
Thanks again for the article!
Rob
Good stuff, thanks!
Pingback: Rebalancing Strategies
Pingback: Simple Portfolio Rebalancing: Year-End vs. Random Day — My Money Blog