The US stock market appears to be caught in another one of its extended corrections. Is this the start of a long bear market? Or could this be just another garden variety correction that ends quickly? As always, the future’s uncertain. All the more so given the global blowback due to the war in Ukraine.
How the future plays out is clear as mud, but for some perspective on managing expectations we can start by reviewing the history of stock market drawdowns. The obvious takeaway: We’ve been here before, many times… so far.
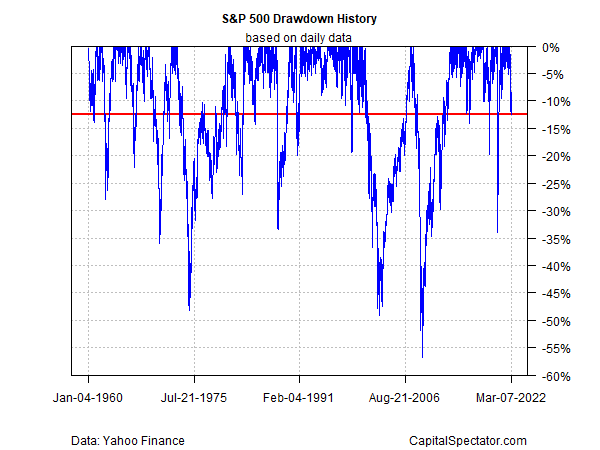
Let’s start with a simple history of drawdowns for the S&P 500 Index. As the first chart shows the current 12.4% peak-to-trough decline (through Mar. 7, 2022) is still a middling slide (red line). At the moment, there’s nothing unusual about the market’s downturn in terms of precedent.

For those keeping score, the drawdown to date is the 19th deepest since 1950. In other words, the correction could yet become substantially deeper and still rank as “normal,” or at least unprecedented.
The next chart provides another spin on where we stand at the moment vs. the steepest previous drawdowns. The current drawdown is still a youngster — the market’s previous peak was roughly two months earlier: January 4, 2022. As for where we go from here, it’s anyone’s guess at this point. As a thought experiment, let’s consider the darker outlook and compare the current slide to the ten-deepest drawdowns since 1950. A quick rebound looks unlikely, or so history suggests. The one outlier: the recovery from the March 2020 coronavirus crash. But that was unusual and the current situation is quite different and so it seems reasonable to prepare for what could be a relatively long run with the S&P bouncing around at levels well below the previous peak.

For another view of drawdown history, the chart below shows that the current drawdown is near the cusp of slipping into the realm of the sharpest losses. At roughly the -15% mark, give or take, it appears that the market crosses the Rubicon and enters into the deepest realm of drawdown activity. By that standard, the market is currently near the precipice.

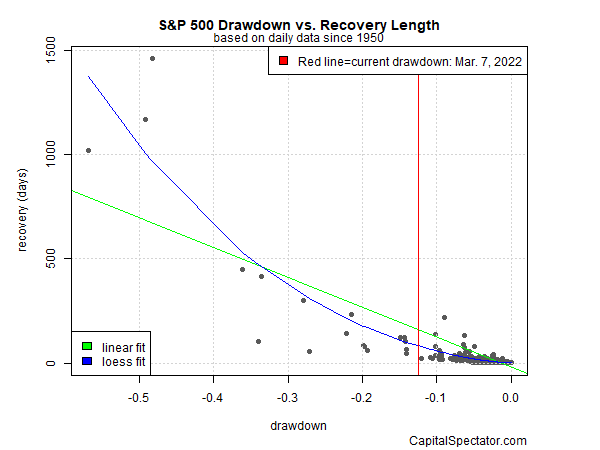
Finally, what should we expect for a market recovery? The speed of recovering the previous high depends, not surprisingly, on the depth of the loss. Looking at the S&P’s history since 1950 tells us that for the garden variety drawdown (roughly no more than -10%), returning to a previous high is a relatively swift affair – less than 100 trading days for the most part. But as the final chart below reminds, recovery periods become a bit chaotic once the drawdown is deeper than -10%, a neighborhood where Mr. Market currently resides.

Learn To Use R For Portfolio Analysis
Quantitative Investment Portfolio Analytics In R:
An Introduction To R For Modeling Portfolio Risk and Return
By James Picerno
Thank you!