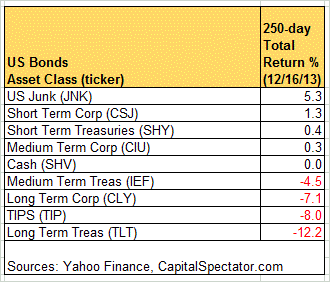
Using a set of proxy ETFs to assess the damage, it’s clear that there’s been almost no place to hide when it comes to Treasuries lately. For perspective, let’s also compare US government bonds with the other major sectors of domestic debt for these United States for the trailing 250-day trading period (roughly the equivalent of one year) through yesterday, December 16:
Here’s how the numbers stack up after rebasing the prices of the bond ETFs to 100 as of December 18, 2012. Not surprisingly, the biggest losses are concentrated in the longest maturities, represented here by the iShares 20+ Year Treasury Bond ETF (TLT), which has shed more than 12% over the past 250 trading days:
As you can see, not every corner of the US bond realm is suffering, at least not yet. Leading the charge with profits: US junk bonds via the SPDR Barclays High Yield Bond ETF (JNK), which is currently higher over the past 250 trading days by slightly more than 5%. Short-term investment-grade corporates (CSJ) also show a slight gain. Even short-term Treasuries (SHY) are in the black, albeit just barely.
The lesson, of course, is to refrain from thinking of US bonds as a monolithic asset class when it comes to portfolio design and rebalancing decisions.

