A year ago, bear-market risk looked elevated for the US stock market, based on a Hidden Markov model (HMM). The warning, which was discussed on these pages at the time (see here, for instance), has had a mixed record. Although stocks swooned in late-2015 and early 2016, the growling was relatively muted in terms of the S&P 500’s drawdown. That’s easy to say now, of course, although the real-time outlook looked quite dark at times. In any case, we’ve come full circle in terms of the HMM signal, which turned bullish late last month for the first time since mid-August 2015. In the wake of what’s been a real-time test of the model, let’s review what we’ve learned about HMM for monitoring bear-market risk.
The HMM project for The Capital Spectator was initially outlined in 2014 with a follow-up article on the model’s timely warning in early 2008 of the bear market that was in its early stages at the time. In short, the evidence looked encouraging for expecting a repeat performance the next time that the stock market ran into trouble.
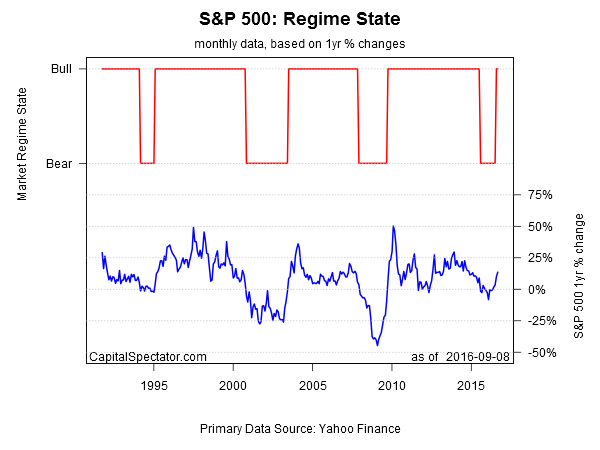
As it turned out, HMM did in fact ring an alarm bell early on. In the wake of the sharp slide in the S&P 500 in late-August 2015, HMM turned bearish by the end of that month. The question, of course, is whether the warning that a bear market had become a high-probability event can be labeled accurate more than a year later? Minds will differ, in part because of the warm and fuzzy rules that circulate for defining bear markets.
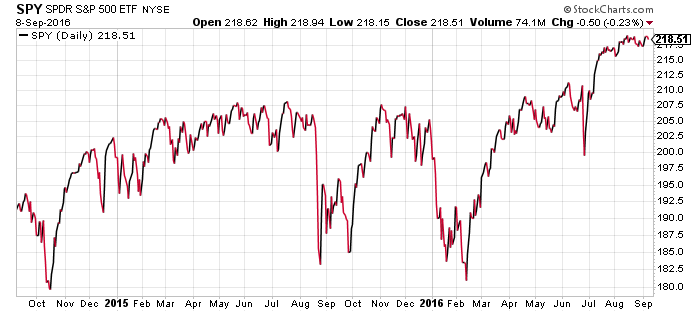
In any case, the S&P 500 endured a turbulent period in the months that followed HMM’s bear signal. The low point for stocks came in Feb. 2016, but the market’s been in rebound mode ever since. The bear market, if we can call it that, turned out to be relatively brief and shallow affair.
Does it all add up to a failure of HMM? Maybe, although to be fair, any model that tries to divine the future is, at best, a statement of probabilities. By that standard, the probabilities for trouble became elevated in late-August 2015 and for a period beyond, although the market’s slide was only moderately painful and relatively short-lived.
So, here we are, a bit more than a year later and HMM’s finally returned to a bullish posture. That’s old news, of course. Even a casual observer has probably long ago decided that the market’s swoon in late-2015 and early 2016 has given way to an upside trend.
The lesson, one can argue, is that HMM is considerably more valuable for signaling the start of bear market conditions. Looking for confirmation of new bull markets, by contrast, is a task better served with other metrics and methodologies.
In any case, here’s how the HMM data stack up at the moment, based on data through yesterday, Sep. 8.

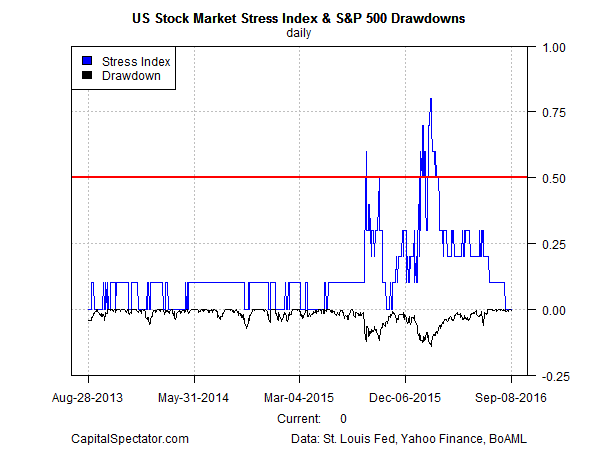
The main takeaway, of course, is that any one indicator has flaws—a reality that inspires looking at a mix of metrics for assessing market risk. One effort on this front is the US Stock Market Stress Index (formerly called the Crash Risk Index), which aggregates ten indicators for evaluating the potential for extreme downside risk (see this post for a list of metrics, which includes HMM).
The obvious question: Did the Stress Index (SI) perform any better than HMM? Here, too, the record is mixed over the last 12 months. Although SI briefly rose above the critical level of 0.5 in late-August 2015, and again in January and February of this year, the implied crash never materialized, at least nothing on par with the 2008 financial crisis. At the moment, SI has returned to a zero reading, which is to say that crash risk potential is virtually nil at the moment by this indicator’s reckoning.
While financial Armageddon didn’t follow the previous warnings of HMM and SI, it’s not obvious that the estimates of elevated risk were wrong per se. It’s clear that the stock market had a rough ride in last year’s second half and in the early months of 2016. The fact that the trouble was relatively contained can be attributed to the relative stability of the US macro trend, i.e., an NBER-defined recession never arrived, although Mr. Market was, for a time, anticipating otherwise.
Therein lies a key lesson: market turbulence that’s not accompanied by clear signs of rising recession risk is likely to be a relatively muted affair. As such, monitoring the macro trend in connection with market signals is essential. Accordingly, The Capital Spectator spends a lot of time modeling macro risk with an objective, rules-based methodology, which shows up on these pages in monthly updates (here, for example) and in weekly reviews via The US Business Cycle Risk Report.
It’s no trivial issue to point out that the US economic trend, although it wobbled, never reached the tipping point in late-2015 and (so far) in 2016, as real-time modeling of macro conditions have revealed all along. The stock market appeared to be predicting otherwise at various times over the past 12 months. But if you were filtering the market’s warnings through a rules-based macro lens, you would have been skeptical that all hell was set to break loose.
Does that mean that we’ll have full clarity in the future? No, of course not. But this much is clear: carefully monitoring market and macro signals is a substantially more reliable methodology than looking at either one in isolation.
Pingback: Bear Market Risk Signals - TradingGods.net
Pingback: Quantocracy's Daily Wrap for 09/09/2016 | Quantocracy