Economic activity weakened slightly in May, but it’s too soon to say if this is anything more than noise. The broad trend for the US was still solidly positive through last month and near-term projections look encouraging.
The expansion this month marks its eight-year anniversary, according to NBER. Data published to date strongly suggests that the recovery will remain intact through June. Forward momentum has decelerated lately, but the slowdown is marginal. Considering that the near-term outlook remains positive, the latest downtick appears to be nothing more than the economy’s normal ebb and flow.
Estimates of second-quarter GDP growth from various sources continue to anticipate a rebound after the weak 1.2% rise in Q1. Wall Street economists, for instance, are predicting that output will accelerate to 2.9%, based on CNBC’s median survey on June 16. That’s a modest pace, but it’s strong enough to keep the darker forces of the business cycle at bay for the foreseeable future.
Meantime, the probability is virtually nil that an NBER-defined recession has started, based on numbers published to date via the Capital Spectator’s proprietary business-cycle indexes. The nearly complete profile for May shows that three of 14 indicators in our model are negative, one more vs. the previous month. Nonetheless, the economy is still poised to expand for the near term. (For a more comprehensive read on business-cycle analysis on a weekly basis, see The US Business Cycle Risk Report.)

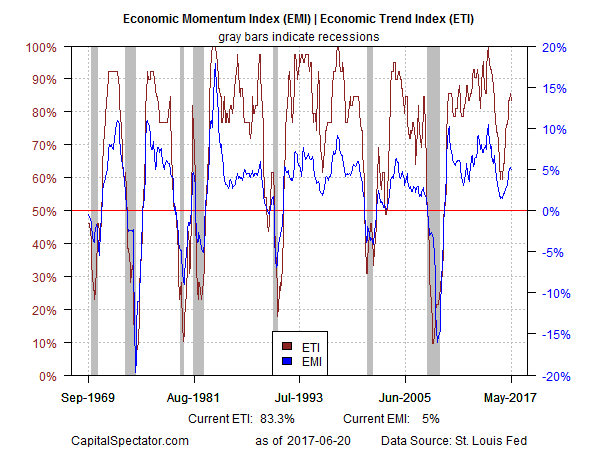
Aggregating the data in the table above continues to show that the broad trend remains positive. The Economic Trend and Momentum indices (ETI and EMI, respectively) continue to print at moderately elevated levels, holding on to gains that unfolded in previous months. As a result, both benchmarks remain well above their respective danger zones: 50% for ETI and 0% for EMI. When/if the indexes fall below those tipping points, we’ll have clear warning signs that recession risk is at a critical level, in which case a new downturn is likely. The analysis is based on a methodology outlined in my book on monitoring the business cycle.
Translating ETI’s historical values into recession-risk probabilities via a probit model also points to low business-cycle risk for the US through last month. Analyzing the data with this methodology indicates that the odds are close to zero that NBER will declare May as the start of a new recession.

For perspective on looking ahead, consider how ETI may evolve as new data is published. One way to project future values for this index is with an econometric technique known as an autoregressive integrated moving average (ARIMA) model, based on calculations via the “forecast” package for R. The ARIMA model calculates the missing data points for each indicator for each month — in this case through July 2017 (March 2017 is currently the latest month with a full set of published data). Based on today’s projections, ETI is expected to remain well above its danger zone in the immediate future.

Forecasts are always suspect, but recent projections of ETI for the near-term future have proven to be relatively reliable guesstimates vs. the full set of published numbers that followed. That’s not surprising, given ETI’s design to capture the broad trend based on multiple indicators. Predicting individual components, by contrast, is prone to far more uncertainty. The assumption here is that while any one forecast for a given indicator will likely be wrong, the errors may cancel out to some degree by aggregating a broad set of predictions. That’s a reasonable view, according to the generally accurate historical record for the ETI forecasts in recent years.
The current projections (the four black dots in the chart above) suggest that the economy will continue to expand. The chart above also includes the range of vintage ETI projections published on these pages in previous months (blue bars), which you can compare with the actual data (red dots) that followed, based on current numbers.
For additional perspective on judging the track record of the forecasts, here are the previous updates for the last three months:
19 May 2017
19 Apr 2017
21 Mar 2017
Note: ETI is a diffusion index (i.e., an index that tracks the proportion of components with positive values) for the 14 leading/coincident indicators listed in the table above. ETI values reflect the 3-month average of the transformation rules defined in the table. EMI measures the same set of indicators/transformation rules based on the 3-month average of the median monthly percentage change for the 14 indicators. For purposes of filling in the missing data points in recent history and projecting ETI and EMI values, the missing data points are estimated with an ARIMA model.
Pingback: Economic Activity Weakened in May - TradingGods.net
Pingback: Forecasts Still Point To Stronger GDP Growth In Q2 vs. Q1 - Tradebuddy.online Stockmarket news - Forex - News - Realtime market Data- World News - Trading Ideas
Pingback: US Job Growth Rebounds In June, But 1-Year Trend Eases - Investing Matters
Pingback: Is Weak Business-Loan Growth A Warning Sign For the Economy? - Investing Matters
Pingback: The Economic Trend Usually Looks Positive When Recessions Start - Investing Matters