Monday’s rally raised hopes that last week’s market swoon was merely another short-lived pullback, a familiar pattern in recent years that briefly rattles investor sentiment before quickly fading. Although it’s too soon to determine whether stocks have established a durable bottom, recent price action suggests the market may be moving in that direction. Here are some of the signs I’m watching to decide where we go from here.
One indication that investor sentiment remains constructive is that the S&P 500’s 200-day moving average held as support. This widely followed trend line serves as a key gauge of the market’s long-term direction and often becomes a battleground between bulls and bears during periods of heightened volatility.
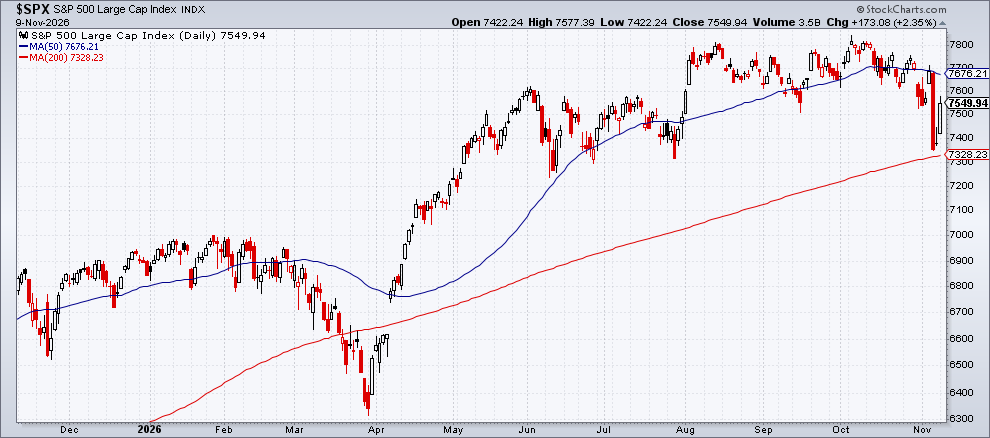
To be fair, it’s premature to view the rebound from the 200-day moving average as strong evidence that stocks are ready to resume their advance. Still, the market’s initial response suggests investors increasingly see the latest correction as a temporary interruption rather than the end of the bull market. From a trend-following perspective, the key question is whether stocks can stabilize and build on recent gains in the days ahead. If they do, the latest bout of volatility may look less like a warning sign and more like another buy-the-dip opportunity.
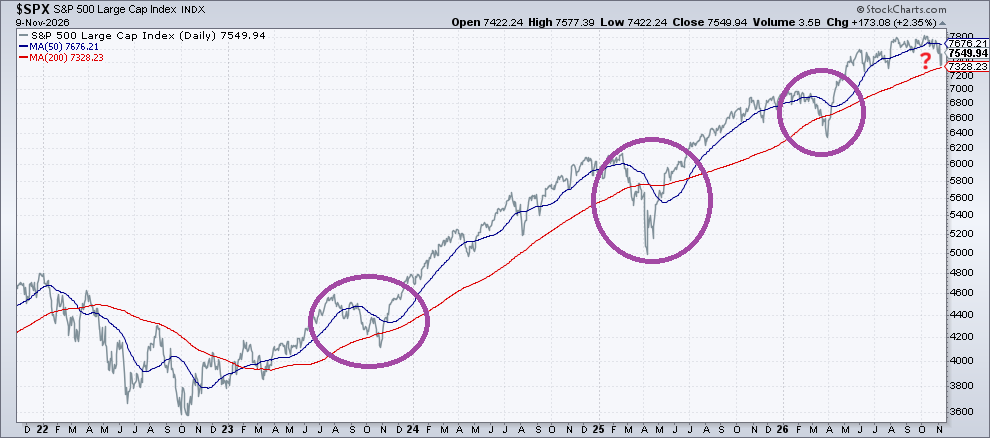
Since recovering from the year-long correction in 2022, the S&P 500 has endured three steep and relatively rapid drawdowns that quickly reversed. There’s no way to know whether the current decline will become the fourth, but the pattern appears to be repeating.
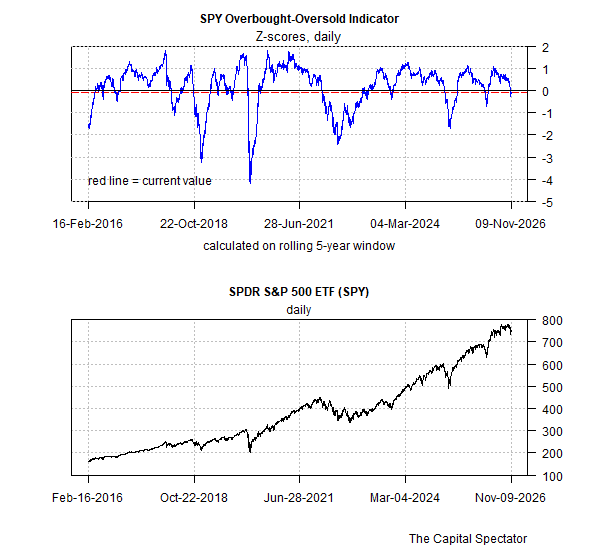
Although market history cannot reliably predict what comes next, it can provide useful context for assessing which way the odds may be tilting. One example is placing recent volatility into a longer-term perspective. The chart below uses a simple model to summarize trend behavior across multiple trailing horizons and quantify the results over a rolling five-year window. By this measure, the latest downturn is relatively mild compared with the pullbacks of recent years, suggesting that any near-term rebound may also be relatively modest and so a trading range may be the best-case scenario for the immediate future.
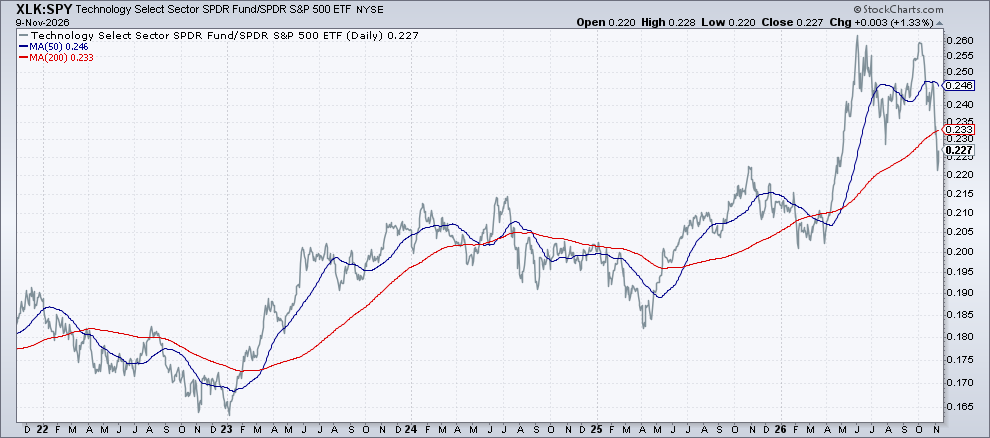
For additional context, it’s useful to review a variety of metrics from other vantage points. The performance of technology stocks is an obvious example. In the chart below, the ratio of the SPDR Technology ETF (XLK) to the SPDR S&P 500 ETF (SPY) has taken a significant hit and may be signaling that the AI-fueled rally of recent years has run its course, at least for now. If the ratio can stabilize and recover, however, it would strengthen the case that the bull market still has room to run. By contrast, a deeper breakdown in technology stocks from here would likely represent a significant headwind for broader market sentiment.
The macro backdrop remains a critical factor as well. Renewed optimism that the worst of the Iran conflict may have passed is back on the table. President Trump yesterday said the conflict is “militarily … effectively over” and that “we’re just keeping it the status quo.” While such statements warrant a healthy degree of skepticism, the oil market is once again signaling a lower-risk outlook. The U.S. crude oil benchmark, West Texas Intermediate, is trading around $85 a barrel, its lowest level since late August. If the recent decline persists or prices move lower, it would likely support both stocks and the risk appetite more broadly.
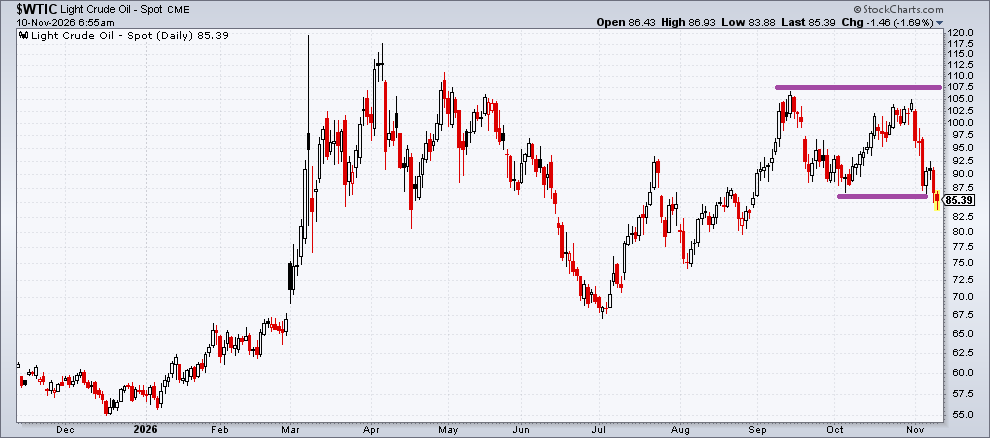
Even if tensions in the Middle East continue to ease, an important question remains: How much war-related inflation is still working its way through the global economy? Only a sustained period of relative calm in the Persian Gulf is likely to convince investors that the Iran-related threat is truly fading. That remains a work in progress, but the latest decline in oil prices suggests that markets are once again embracing the possibility that inflation has either peaked or is close to doing so.
Ultimately, whether the recent rebound marks the start of a lasting recovery or merely a temporary respite will depend on the market’s ability to maintain technical support, weather geopolitical risks, and preserve confidence in the broader economic outlook.
Learn To Use R For Portfolio Analysis
Quantitative Investment Portfolio Analytics In R:
An Introduction To R For Modeling Portfolio Risk and Return
By James Picerno
