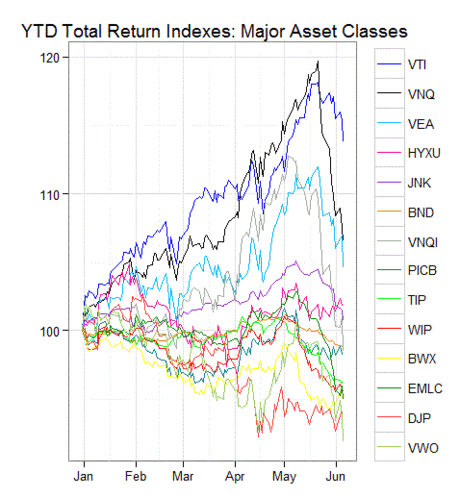
In the previous edition of Asset Allocation & Rebalancing Review I noted that the great divergence in returns in 2013 rolled on. But gravity has since reasserted its authority. There’s still a wide range of returns on a year-to-date basis for the major asset classes, but the range has been squeezed recently.
One change is that US equities and US REITs are no longer flying quite so high, based on my list of proxy ETFs. Meanwhile, emerging market stocks have fallen to the bottom of the year-to-date horse race.

Let’s review how the big picture compares through the prism of an equally weighted portfolio of all the major asset classes with a start date of Dec. 31, 2012. This benchmark portfolio is left to fluctuate according to the ebb and flow of market prices. Here’s how this unmanaged asset allocation stacks up for 2013 through June 5:

Finally, here’s a visual summary of how the major asset classes have performed this year in relative terms through June 5, 2013. In the chart below, all the ETF prices have been reset to 100 as of Dec. 31, 2012:
