Research Review |1.09.13 | Asset Allocation Design & Management

Dynamic Asset Allocation Strategies Based on Unexpected Volatility
Valeriy Zakamulin (University of Agder) | Nov 2013
In this paper we document that at the aggregate stock market level the unexpected volatility is negatively related to expected future returns and positively related to future volatility. We demonstrate how the predictive ability of unexpected volatility can be utilized in dynamic asset allocation strategies that deliver a substantial improvement in risk-adjusted performance as compared to traditional buy-and-hold strategies. In addition, we demonstrate that active strategies based on unexpected volatility outperform the popular active strategy with volatility target mechanism and have the edge over the widely reputed market timing strategy with 10-month simple moving average rule.

The Global Multi-Asset Market Portfolio 1959-2012
Ronald Q. Doeswijk, et al. (Robeco) | Nov 2013
The global multi-asset market portfolio contains important information for strategic asset-allocation purposes. First, it shows the relative value of all asset classes according to the global financial investment community, which one could interpret as a natural benchmark for financial investors. Second, this portfolio may also serve as the starting point for investors who use a framework in the spirit of Black and Litterman (1992), or for investors who follow adaptive asset-allocation policies as advocated by Sharpe (2010). We estimate the invested global market portfolio for the period 1990-2012 by estimating the market capitalization for the eight asset classes: equities, private equity, real estate, high-yield bonds, emerging-market debt, investment-grade credits, government bonds and inflation-linked bonds. For the main asset categories – equities, real estate, non-government bonds and government bonds – we extend the period to 1959-2012. We provide these annual historical estimates in tabular form so that practitioners and academics can easily use these historical data going forward. Next, we compare the asset allocations of institutional global investors to the market portfolio. To our knowledge, we are the first to document the global multi-asset market portfolio at these levels of detail for such a long period of time.

Dynamic Risk Allocation with Carry, Value and Momentum
Boris Gnedenko and Igor Yelnik (ADG Capital Mgt) | Nov 2013
According to recent research, diversification across risk factors (or investment styles) proves to be more efficient than traditional asset class diversification. In this paper, we take the next step and show that it is economically worthwhile to combine risk factors in a dynamic manner, in a process that we call Dynamic Risk Allocation (DRA). Building a DRA portfolio by means of several unconventional heuristics adds robustness and intuition to the whole portfolio construction process. Our main finding is that risk factor allocation largely replaces traditional global equity and bond market premiums as well as allocation to hedge funds (in expected utility maximization sense). Hence we question the economic validity of the alpha-beta separation paradigm that currently prevails in the industry. Adopting existing optimal rebalancing techniques, we show that our results are robust to transaction costs. Our empirical analysis is made for a global portfolio of 3 well-known risk factors: momentum, value and carry. To minimize data mining effects, each risk factor is broadly diversified across 4 global asset classes and taken both in cross-sectional and time series contexts. We test our approach using 38 years of daily historical prices in a broad set of futures contracts and major FX rates.

Investing in Systematic Factor Premiums
Kees C. G. Koedijk (Tilburg University), et al. | Aug 2013
Investments in certain segments of the market realize better returns over longer periods than those in other segments. Leading academic studies from the eighties onwards demonstrate, for instance, that value, momentum, smallcap and low-volatility stocks systematically generate higher risk-adjusted returns.
Investments in these segments or factors are also known as anomalies, as these factors cannot be explained by classic investment theories. However, allocation by institutional investors to strategies that explicitly capitalize on the benefits of these factors is now supported by academic research.
This report takes as its starting point the study by researchers Ang, Goetzmann and Schaefer (2009) for the Norwegian Government Pension Fund, the first such study to explicitly recommend factor investing. This pension fund is one of the largest active investors in the world. When in 2008 ten years’ worth of cumulative outperformance was wiped out, the fund launched an investigation to evaluate the effects of active management. The researchers concluded that the exposure to factor premiums clearly accounted for the fund’s results. Their conclusion is clear: factor investing must be part of the strategic asset allocation of institutional investors. However, this begs further questions:
•what is the added value of factor investing?
•what are these underlying factors?
•how can a pension fund best put together a portfolio?
This report provides answers to these questions. As a follow-up to the study by Ang, Goetzmann and Schaefer, it is very topical, as many institutional investors are investigating the opportunities provided by factor investing.

ADP: December’s Job Growth Is The Highest For 2013

The pace of job creation in the private sector accelerated last month, according to the ADP National Employment Report. The 238,000 increase (seasonally adjusted) at 2013’s close marks the third monthly rise above 200,000 and the biggest advance in more than a year. The upbeat news implies that Friday’s payrolls release from the US Labor Department for December will also compare favorably with recent history.

“The job market ended 2013 on a high note,” says Mark Zandi, chief economist of Moody’s Analytics, which produces the employment report with ADP. “Job growth meaningfully accelerated and is now over 200,000 per month. Job gains are broad-based across industries, most notably in construction and manufacturing. It appears that businesses are growing more confident and increasing their hiring.”

The next question: Are businesses also less inclined to lay off workers? Tomorrow’s weekly update on initial jobless claims will offer a clue. There’s some mildly bullish movement on this front lately, with new filings for unemployment benefits dropping in each of the past two weekly reports. If tomorrow’s news extends the trend, the case for optimism will strengthen further as we await Friday’s news from Washington.

But let’s not go overboard. Although today’s ADP data is encouraging, monthly estimates are noisy. Take another look at the chart above for the year-over-year comparisons (the red circles). ADP tells us that private payrolls increased 1.9% in December vs. the year-earlier level. That’s roughly in line with the pace we’ve seen in last year’s third quarter. Yes, it’s also a bit faster than the annual rate that prevailed earlier in 2013. But for the moment, it’s fair to say that employment is still growing at a pace that’s only slightly better than we’ve seen lately.

If we’re finally at the stage where growth is set to pick up, we’ll see more evidence in the hard data in the weeks to come. For now, that’s still wishful thinking, albeit with a bit more confidence for assuming that the long-awaited payday has finally arrived.

REITs, Asset Allocation, & The Correlation Headwind

Morningstar’s Samuel Lee warns “that REITs’ diversification powers are down and so are their expected returns.” Maybe, but it’s premature to dismiss the asset class, particularly as part of a broadly diversified asset allocation plan. Nothing is static in the financial markets and so today’s profile of risk and return is sure to change.

The challenge with REITs is the simple fact that these securities—a liquid proxy for tapping real estate—have had a strong run. Lee sums up this stellar history and considers the investment implications going forward:

A common argument for REITs is a simple appeal to long-run historical returns. From the beginning of 1972, when the FTSE NAREIT US Equity REIT Index data begin, to the end of August 2013, REITs returned 11.9% annualized. U.S. stocks returned about 10.3% annualized over the same period. REITs earned high returns because their yields were high. It bears repeating that almost all of the real return REITs have produced can be attributed to dividends. Price appreciation only kept up with inflation. Something about REITs changed in the early 2000s. My theory is that for most of their existence REITs were a small, illiquid asset class, neglected by the mainstream and known largely to a small set of venturesome investors. The asset class gained mainstream acceptance as the real estate bubble inflated. Even though the bubble eventually popped, REITs were established as a major asset class, easily accessible, and now ensconced in the big, conventional market indexes like the S&P 500. The abundant accessibility and liquidity surrounding REITs seem to have permanently altered their risk-return characteristics.

A simple way to test this is to see how REIT’s comovement to the market has changed over time. I calculated a rolling three-year market beta, controlling for REITs’ exposure to size, value, momentum, and interest-rate risks, to better isolate pure market exposure. The change is striking: REITs went from an average market beta of 0.5 to over 1 in the early 2000s and have stayed there since. Over this period, REITs went from small-cap, deep-value stocks to larger-cap, growthier stocks.

But let’s review some basic numbers for another perspective. It’s no surprise that REITs have had a rough time lately. The shares, after all, are interest-rate sensitive investments. Accordingly, recent history hasn’t been particularly supportive for REITs, thanks to the beginning of the end of the Federal Reserve’s bond-buying program–a change in the monetary weather that has pushed interest rates up recently, albeit gently so far. The benchmark 10-year Treasury yield has climbed to around 3%, up from 1.7% last spring. The headwind with rates has weighed on REITs, with the MSCI REIT Index advancing a sluggish 2.5% in 2013, or far below the nearly 34% total return for stocks (Russell 3000).

But disappointing performance is the foundation for better days ahead when it comes to asset classes. At some point down the road, REIT yields will be higher and the prospective outlook for the securities will look brighter. Lee’s cautious outlook for the sector shouldn’t be dismissed, but let’s not throw the baby out with the bathwater by thinking that today’s analysis is written in stone.

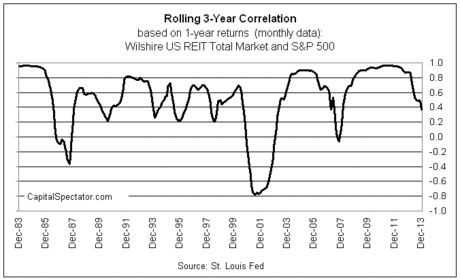
The same applies for correlations. Consider the history of rolling three-year return correlations for REITs and US stocks (S&P 500), based on one-year returns via average monthly prices. As you can see in the chart below, the high correlation period between REITs and stocks of recent years has fallen sharply over the past year. This is a byproduct of the performance divergence between the two asset classes of late. But unless you think that stocks are REITs are now destined to move in lockstep from now on, the diversification potential for the two asset classes is still intriguing.

True, it’s tempting to write off REITs in favor of stocks given last year’s performance history. But the outsized gains for equities won’t last forever—ditto for the comparatively depressed returns for REITs. Risk and return are forever changing for each asset class, and not necessarily on an identical time schedule, as 2013’s performance record reminds.

The bigger problem is that correlations generally, across all asset classes, are likely to rise in the years ahead. The danger for investors, as William Bernstein explains in his recent e-book, is that we’re all “Skating Where the Puck Was.” Ours is a world where tapping into a broad set of formerly obscure asset classes and trading strategies is now easy and inexpensive (think ETFs). The average investor can build and manage multi-asset class portfolios to a degree that was once the exclusive province of institutions. As a result, the low-hanging fruit of low correlations has probably been picked.

The bottom line: risk premiums will be lower, in part because correlations will be higher. As such, you’ll have to work harder (and smarter) to keep portfolio returns from sliding at a given risk level. That’s hardly a reason to abandon asset allocation–doing so may end up making your job that much harder. But it’s a reminder that we’ll have to do better job in managing the mix. Rebalancing, in other words, is destined to become even more important as a factor in the investment solution in the years ahead. Most investors will still need a wide spectrum of asset classes to achieve respectable results, but it’s not going to get any easier to turn water into wine.

Adding Triangular Distributions To The Forecasting Repertoire

In the coming weeks you’ll see a new forecasting methodology rolled into the economic previews that routinely appear on The Capital Spectator (see here, for instance). As a brief introduction, let’s consider a real world example by crunching the numbers for tomorrow’s estimate of US private payrolls from ADP.

The new model is based on combining forecasts with a technique known as triangular distributions, which require only three inputs: minimal, maximal and “most likely” or modal values (HT: Michael Helbraun at Revolution Analytics). Here’s how Wikipedia explains the rationale for using this technique for estimating future values of a time series:

The triangular distribution is typically used as a subjective description of a population for which there is only limited sample data, and especially in cases where the relationship between variables is known but data is scarce (possibly because of the high cost of collection). It is based on a knowledge of the minimum and maximum and an “inspired guess” as to the modal value. For these reasons, the triangle distribution has been called a “lack of knowledge” distribution.

As for combining forecasts, the inspiration flows from a long line of research that tells us that aggregating predictions tends to be more reliable than the individual estimates. This is old news (the formal research on the topic dates to at least 1969 by way of the widely cited Bates and Granger paper), but it’s no less relevant in the 21st century in the perennial job of managing uncertainty. As Allan Timmermann noted in a 2005 study: “Forecast combinations have frequently been found in empirical studies to produce better forecasts on average than methods based on the ex-ante best individual forecasting model.”

Adding triangular distributions (TDs) to the mix offers a bit more control in managing the uncertainty that infects predictions. Because TDs draw on a different set of assumptions and techniques vs. the other models used on these pages, the average forecast is, in theory, slightly more robust in a statistical sense.

The approach here starts with using Econoday.com’s consensus forecast for the data set under scrutiny (in this case tomorrow’s ADP report) as the proxy for the “most likely” value. The minimal and maximal values are represented by the outer extremes of each survey’s forecasts. For today’s ADP projection, the Econoday/TD-based estimate is combined with three additional forecasts via econometric techniques that are standard tools in the economic previews on these pages: an autoregressive integrated moving average (ARIMA) model, an exponential smoothing model, and a vector autoregression model. In each case, the point forecast is used to represent the “most likely” value, with the upper and lower numbers for the 95% confidence intervals representing the minimal and maximal values.

With the data sets in hand, we then run a Monte Carlo simulation on the combined forecasts and generate 1 million data points on each forecast series to estimate a triangular distribution. (The econometric engine here is the “triangle” package that’s run in R.) Finally, we take random samples from each of the four simulated data sets and use the expected value with the highest frequency as our prediction.

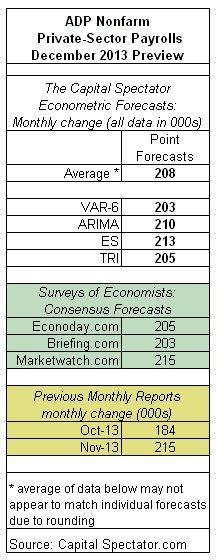
The results are show below, with the triangular distribution forecast indicated by “TRI”. Taking the average of all four estimates tells us that tomorrow’s December ADP employment report is projected to show a 208,000 gain for private payrolls over the previous month. That’s a bit less than November’s 215,000 rise, but moderately higher than we’ve seen in recent history. Meanwhile, the Capital Spectator’s average 208,000 projection is in the middle of a trio of consensus forecasts for December via surveys of economists:

adp.07jan2014.gif

VAR-6: A vector autoregression model that analyzes six economic time series in context with the ADP private payroll employment. The six additional series: the ISM Manufacturing Index, industrial production, index of weekly hours worked, US stock market (S&P 500), spot oil prices, and the Treasury yield spread (10 year Note less 3-month T-bill). The forecasts are run in R with the “vars” package.

ARIMA: An autoregressive integrated moving average model that analyzes the historical record of the ADP private payroll employment in R via the “forecast” package.

ES: An exponential smoothing model that analyzes the historical record of the ADP private payroll employment data in R via the “forecast” package.

A New Year (And Old Challenges)

What are the primary challenges for designing and managing portfolio strategies in the new year? The same ones that bedeviled us in 2013. At the top of the list is a tendency to overlook the portfolio and instead focus on the individual pieces that collectively add up to “the strategy.”

Markowitz long ago told us that “Portfolio Selection” is the holy grail of investing decisions. But you can’t embrace this strategic advice unless you spend time thinking of your various investments as one aggregated fund. That’s harder than it sounds, in part because the world is constantly inviting you to focus on the parts rather than the whole. It’s unsurprising that portfolio perspective is forever in short supply in the wider world of analysis and news. Asset allocation design and management scream out for customized solutions. In other words, you’ll have to do most of the work yourself in the critical cause of analyzing and monitoring your investments from a top-down portfolio perspective.

Where to begin? The first order of business is generating returns for your portfolio. The good news is that there’s no shortage of tools (often at no charge) on the web. Morningstar’s Portfolio Manager is one example (click on the “Portfolio” tab at the top of Morningstar.com). Regularly monitoring how your portfolio ebbs and flows in absolute and relative terms is essential. Every portfolio has a unique risk and return profile. The question, of course, is whether the profile that defines your portfolio is appropriate for you?

Developing confidence that you’re on the right track is a process, and one that takes time and regular monitoring. No wonder that many investors choose to hire a financial advisor. If you’re inclined to do it yourself, you’ll need a plan to stay on the straight and narrow. Portfolio analysis can easily turn into a black hole if you’re not careful. Creating a blur of data in the 21st century is about as difficult as walking, which is why prioritizing your analytical path is so critical.

The foundation is calculating returns, of course. For most investors, simply reviewing how the portfolio has performed can be an eye-opening experience. Assuming your strategy is reasonably diversified, there’s a good chance that the monthly results will be closely correlated with a naïve portfolio of betas, such as the Global Market Index. The priority is deciding how, or if, to adjust your portfolio’s risk and return profile through time. Again, this isn’t a one-time decision; it’s a process, and one that can only be intelligently managed by routinely dissecting the portfolio.

In other words, you need good data on how the portfolio is evolving. Consider a simple 60%/40% US stock/bond portfolio. Let’s say that we created this portfolio with a pair of ETFs (SPY and AGG), with an inception date of Dec. 31, 2003. You might think that’s there’s not much to consider with such a basic investment strategy. In fact, there are multiple perspectives to review in the search of valuable context. For instance, here’s how the rolling 1-year correlations between the two ETFs compare for the past decade, based on 90-day windows for trailing 12-month returns (plotted daily):

If you owned this portfolio, what might the correlation history imply about adjusting the mix? Do high correlations between the assets offer more opportunity for portfolio changes? Or should we emphasize low correlations as the basis for timely adjustments? Is a 90-day look-back window superior to a longer period? Should we analyze return correlations based on one-year returns—or three- or five-year returns?

Before you go off the deep end on any analytical pursuit, keep in mind that the key decisions for any portfolio can be reduced to: 1) choosing the initial asset allocation; and 2) deciding how and when (or if?) to rebalance. Analytics should be designed and implemented with the goal of providing useful information to help us make better choices about these two aspects of portfolio management. Everything else is usually noise.

As challenging as this task is, it’s a lot tougher if you’re easily distracted by the media’s focus on the parts rather than the whole. It’s tempting to think that the financial story du jour is the most important piece of intelligence for managing your investments. But ask yourself some simple but important questions: How much do you know about your portfolio’s risk/return profile? How does it compare with a passive benchmark for a comparable strategy? What does the risk/return profile imply about how, or if, you should change your asset allocation and/or rebalancing strategy?

The more you think about these critical questions (and how to come up with intelligent answers), the more you’re likely to recognize that most of what’s served up by the usual suspects in the media is irrelevant for building and managing investment portfolios that will help us achieve our financial goals with minimal risk. In this respect, the new year promises to be more or less unchanged from 2013.

Book Bits | 1.04.14

Catching Lightning in a Bottle: How Merrill Lynch Revolutionized the Financial World
By Winthrop H. Smith Jr.
Interview with author via Wealthtrack
Why does a book about the creation, rise and fall of Merrill Lynch matter today? Because the rise of the world’s once largest brokerage firm is emblematic of Wall Street’s great success and critical role in the growth and prosperity of this country and the firm’s failure, of the misguided priorities permeating Wall Street today. In this Wealthtrack interview we talk to Win Smith, author of the just published Catching Lightning in a Bottle: How Merrill Lynch Revolutionized the Financial World. Smith, the former Chairman of Merrill Lynch International resigned from the firm in 2001 because he disagreed with how the firm was being run. This is a fascinating history of Wall Street, two visionary entrepreneurs, their extraordinary achievements and the ultimate destruction of the great firm they created.

Investing with the Trend: A Rules-based Approach to Money Management
By Gregory L. Morris
Excerpt via publisher, Wiley
Modern financial theory wants you to believe that the markets do not trend, are efficient, and therefore cannot be exploited for profit. They state that it is random and is normally distributed except for some very long-term periods that last many decades. What they ignore is that the market is made up of people, frail humans who act and invest like humans. Humans can be rational and they can be irrational, rarely knowing which is present and when. Being rational at times and being irrational at times is normal. This is not random behavior and is quite predictable. Hopefully this book demonstrates those failings and offers a solution.

Strategic Value Investing: Practical Techniques of Leading Value Investors
By Stephen Horan, et al.
Summary via publisher, McGraw Hill
Benjamin Graham referred to it as his “margin of safety.” Seth Klarman favors it over all other investment methods. Warren Buffett uses it to make millions for his investors. It’s called value investing, and you can make it work wonders for your portfolio. All you need is money to invest, a little patience—and this book. Strategic Value Investing reveals everything you need to know to build a world-class portfolio using value investing as your north star. Written by experts on valuation and financial analysis, this comprehensive guide breaks it all down into an easy-to-implement process.

Tail Risk Hedging: Creating Robust Portfolios for Volatile Markets
By Vineer Bhansali
Summary via publisher, McGraw-Hill
One of investors’ greatest concerns since the global financial crisis are the unpredictable, worst-case-scenario events that occur on tail of the bell curves they analyze; this guide provides actionable steps investors can take to hedge their portfolios against these tail risks. Bhansali provides a rare, inside look at the way PIMCO approaches tail risk hedging–providing the first clear, concise, and focused approach to the technique. Coauthor of Fixed Income Finance, Bhansali is the executive vice president, portfolio manager, and firm-wide head of analytics for portfolio management at PIMCO

Risk: A Study of Its Origins, History and Politics
By Matthias Beck and Beth Kewell
Summary via publisher, World Scientific
Over a period of several centuries, the academic study of risk has evolved as a distinct body of thought, which continues to influence conceptual developments in fields such as economics, management, politics and sociology. However, few scholarly works have given a chronological account of cultural and intellectual trends relating to the understanding and analysis of risks. Risk: A Study of its Origins, History and Politics aims to fill this gap by providing a detailed study of key turning points in the evolution of society’s understanding of risk. Using a wide range of primary and secondary materials, Matthias Beck and Beth Kewell map the political origins and moral reach of some of the most influential ideas associated with risk and uncertainty at specific periods of time. The historical focus of the book makes it an excellent introduction for readers who wish to go beyond specific risk management techniques and their theoretical underpinnings, to gain an understanding of the history and politics of risk.

Aid on the Edge of Chaos: Rethinking International Cooperation in a Complex World
By Ben Ramalingam
Summary via publisher, Oxford University Press
It is widely recognised that the foreign aid system – which today involves every country in the world – is in need of drastic change. But there are conflicting opinions as to what is needed. Some call for dramatic increases in resources, to meet long-overdue commitments, and to scale up what is already being done around the world. Others point to the flaws in aid, and bang the drum for cutting it altogether – and argue that the fate of poor and vulnerable people be best placed in the hands of markets and the private sector. Meanwhile, growing numbers are suggesting that what is most needed is the creative, innovative transformation of how aid works. Aid on the Edge of Chaos is firmly in the third of these camps.

Q4:2013 US GDP Nowcast: +2.9% | 1.03.2014

Last year’s fourth-quarter US GDP is expected to increase 2.9% (real seasonally adjusted annual rate), according to The Capital Spectator’s revised average econometric nowcast. The projected growth rate is substantial higher than the previous 2.0% estimate, which was published on December 9. The government’s initial estimate of 2013’s Q4 GDP is scheduled for release on January 30.

Although the current nowcast represents an improvement over last month’s projection, the Q4 GDP outlook of 2.9% growth still falls well short of Q3’s 4.1% increase, as reported by the Bureau of Economic Analysis last month. Nonetheless, economists advise that the macro outlook is improving, as suggested by yesterday’s upbeat reports on jobless claims and the ISM Manufacturing Index. “The underlying trends are pointing to the economy accelerating as we move through the year,” Joel Naroff, chief economist at Naroff Economic Advisors, tells Reuters. “Conditions seem to be coming together for a very good year.”

Here’s how The Capital Spectator’s current Q4 nowcast compares with recent history and several forecasts from other sources:

Next, let’s review the individual nowcasts:

gdp.b.03jan2014.gif

Here’s how the Q4:2013 nowcast updates compare so far:

Finally, here’s a brief profile for each of The Capital Spectator’s nowcast methodologies:

R-4: This estimate is based on a multiple regression in R of historical GDP data vs. quarterly changes for four key economic indicators: real personal consumption expenditures (or real retail sales for the current month until the PCE report is published), real personal income less government transfers, industrial production, and private non-farm payrolls. The model estimates the statistical relationships from the early 1970s to the present. The estimates are revised as new data is published.

R-10: This model also uses a multiple regression framework based on numbers dating to the early 1970s and updates the estimates as new data arrives. The methodology is identical to the 4-factor model above, except that R-10 uses additional factors—10 in all—to nowcast GDP. In addition to the data quartet in the 4-factor model, the 10-factor nowcast also incorporates the following six series:

• ISM Manufacturing PMI Composite Index
• housing starts
• initial jobless claims
• the stock market (S&P 500)
• crude oil prices (spot price for West Texas Intermediate)
• the Treasury yield curve spread (10-year Note less 3-month T-bill)

ARIMA GDP: The econometric engine for this nowcast is known as an autoregressive integrated moving average. This ARIMA model uses GDP’s history, dating from the early 1970s to the present, for anticipating the target quarter’s change. As the historical GDP data is revised, so too is the nowcast, which is calculated in R via the “forecast” package, which optimizes the parameters based on the data set’s historical record.

ARIMA R-4: This model combines ARIMA estimates with regression anlaysis to project GDP data. The ARIMA 4 model analyzes four historical data sets: real personal consumption expenditures, real personal income less government transfers, industrial production, and private non-farm payrolls. This model uses the historical relationships between those indicators and GDP for projections by filling in the missing data points in the current quarter with ARIMA estimates. As the indicators are updated, actual data replaces the ARIMA estimates and the nowcast is recalculated.

VAR 4: This vector autoregression model uses four data series in search of interdependent relationships for estimating GDP. The historical data sets in the R-4 and ARIMA R-4 models noted above are also used in VAR-4, albeit with a different econometric engine. As new data is published, so too is the VAR-4 nowcast. The data sets range from the early 1970s to the present, using the “vars” package in R to crunch the numbers.

ARIMA R-NIPA: The model uses an autoregressive integrated moving average to estimate future values of GDP based on the datasets of four primary categories of the national income and product accounts (NIPA): personal consumption expenditures, gross private domestic investment, net exports of goods and services, and government consumption expenditures and gross investment. The model uses historical data from the early 1970s to the present for anticipating the target quarter’s change. As the historical numbers are revised, so too is the estimate, which is calculated in R via the “forecast” package, which optimizes the parameters based on the data set’s historical record.

ISM Manufacturing Index: December 2013 Preview

The ISM Manufacturing Index is expected to increase marginally to 57.8 in today’s December update (scheduled for release this morning at 10:00 am New York time), based on The Capital Spectator’s average econometric forecast. The estimate compares with the previously reported 57.3 for November. Meanwhile, the Capital Spectator’s average projection is moderately above a trio of consensus forecasts for December via surveys of economists.

Here’s a closer look at the numbers, followed by brief summaries of the methodologies behind The Capital Spectator’s projections:

ism.02jan2014.gif

VAR-1: A vector autoregression model that analyzes the history of industrial production in context with the ISM Manufacturing Index. The forecasts are run in R with the “vars” package.

VAR-6: A vector autoregression model that analyzes six economic time series in context with the ISM Manufacturing Index. The six additional series: industrial production, private non-farm payrolls, index of weekly hours worked, US stock market (S&P 500), spot oil prices, and the Treasury yield spread (10 year Note less 3-month T-bill). The forecasts are run in R with the “vars” package.

ARIMA: An autoregressive integrated moving average model that analyzes the historical record of the ISM Manufacturing Index in R via the “forecast” package.

ES: An exponential smoothing model that analyzes the historical record of the ISM Manufacturing Index in R via the “forecast” package.

Major Asset Classes | December 2013 | Performance Review

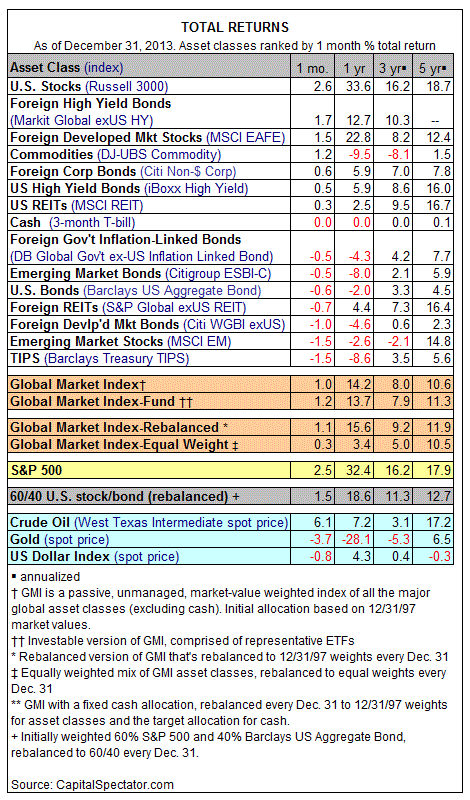
The year just passed delivered an unusually wide spectrum of results among the major asset classes. US equities were firmly in the lead, surging more than 30% in 2013. At the final bell for 2013, the biggest retreat was in commodities overall, which sunk more than 9%, based on the DJ-UBS Commodity Index.

In a year filled with an ample supply of surprising twists and turns, broad diversification remained competitive. The Global Market Index (GMI) was ahead last year by a bit more than 14%, dispensing a strong calendar-year performance and offering another reminder that outperforming Mr. Market’s asset allocation is as challenging as ever.

gmi.02jan2014.gif

For the lucky (smart?) few who managed to beat the odds, last year’s recipe for success came in two basic flavors: overweight developed-world stocks (US equities in particular) and/or go light on bonds. It’s anyone’s guess what 2014’s winning strategy will be. That doesn’t stop the pundits from offering advice. But before you go off the deep end and embrace a self-proclaimed oracle’s forecasts, ask yourself a simple question: How do his predictions from a year ago stack up today?

Speaking of predictions, here’s one that’s likely to stand the test of time: GMI’s performance in 2014 will remain above average when we tally the numbers a year from now vs. a broad span of actively managed efforts intent on generating superior results. History suggests that’s a relatively safe forecast, which implies that you need a hefty dose of confidence (or hubris) to move dramatically away from Mr. Market’s portfolio mix in the year ahead.

2014 Kicks Off With A Pair Of Upbeat Macro Numbers

The new year’s off to an encouraging start with economic news. Today’s updates on jobless claims and the ISM Manufacturing Index suggest that moderate growth was still bubbling in the final month of 2013. Although December’s macro profile is still largely a mystery, the numbers du jour imply that last year’s finale will compare favorably with recent history when the full set of data is published in the weeks ahead.

New filings for jobless claims inched lower again last week, dipping 2,000 to a seasonally adjusted 339,000 for the week through December 28. Although that’s still elevated compared with the post-recession low of 294,000 set back in September, claims are again falling. Today’s retreat is the second weekly decline in a row—a trend we haven’t seen since November. A more persuasive sign of optimism: claims fell last week by nearly 9% vs. the year-earlier level. For the moment, it appears that this leading indicator is again signaling that the labor market will continue growing for the near term. The warnings signs that we saw earlier this month for this series now looks like another false alarm.

Meantime, the manufacturing sector is humming along nicely, according to the latest report from the Institute for Supply Management. Although manufacturing growth for December was a bit softer than expected, the 57.0 reading for last month equates with a healthy rate of expansion (readings above the neutral 50.0 mark equate with growth). Keep in mind that the employment and new orders components in today’s ISM report posted slightly stronger numbers, suggesting that manufacturing’s growth is broad and deep.

The economy’s positive momentum has been conspicuous for some time, as recent history reminds. In last month’s update of the Economic Trend & Momentum indexes, business cycle risk remained low through November and the near-term projections imply that more of the same is on tap. Today’s twin updates certainly offer no reason to change that outlook. It remains to be seen if the year ahead will bring a stronger rate of jobs creation, but it’s a bit easier to think that’s a plausible scenario after looking at today’s numbers.

Yes, it’s been a good year so far for economic news.