Book Bits | 1.04.14

Catching Lightning in a Bottle: How Merrill Lynch Revolutionized the Financial World
By Winthrop H. Smith Jr.
Interview with author via Wealthtrack
Why does a book about the creation, rise and fall of Merrill Lynch matter today? Because the rise of the world’s once largest brokerage firm is emblematic of Wall Street’s great success and critical role in the growth and prosperity of this country and the firm’s failure, of the misguided priorities permeating Wall Street today. In this Wealthtrack interview we talk to Win Smith, author of the just published Catching Lightning in a Bottle: How Merrill Lynch Revolutionized the Financial World. Smith, the former Chairman of Merrill Lynch International resigned from the firm in 2001 because he disagreed with how the firm was being run. This is a fascinating history of Wall Street, two visionary entrepreneurs, their extraordinary achievements and the ultimate destruction of the great firm they created.

Investing with the Trend: A Rules-based Approach to Money Management
By Gregory L. Morris
Excerpt via publisher, Wiley
Modern financial theory wants you to believe that the markets do not trend, are efficient, and therefore cannot be exploited for profit. They state that it is random and is normally distributed except for some very long-term periods that last many decades. What they ignore is that the market is made up of people, frail humans who act and invest like humans. Humans can be rational and they can be irrational, rarely knowing which is present and when. Being rational at times and being irrational at times is normal. This is not random behavior and is quite predictable. Hopefully this book demonstrates those failings and offers a solution.

Strategic Value Investing: Practical Techniques of Leading Value Investors
By Stephen Horan, et al.
Summary via publisher, McGraw Hill
Benjamin Graham referred to it as his “margin of safety.” Seth Klarman favors it over all other investment methods. Warren Buffett uses it to make millions for his investors. It’s called value investing, and you can make it work wonders for your portfolio. All you need is money to invest, a little patience—and this book. Strategic Value Investing reveals everything you need to know to build a world-class portfolio using value investing as your north star. Written by experts on valuation and financial analysis, this comprehensive guide breaks it all down into an easy-to-implement process.

Tail Risk Hedging: Creating Robust Portfolios for Volatile Markets
By Vineer Bhansali
Summary via publisher, McGraw-Hill
One of investors’ greatest concerns since the global financial crisis are the unpredictable, worst-case-scenario events that occur on tail of the bell curves they analyze; this guide provides actionable steps investors can take to hedge their portfolios against these tail risks. Bhansali provides a rare, inside look at the way PIMCO approaches tail risk hedging–providing the first clear, concise, and focused approach to the technique. Coauthor of Fixed Income Finance, Bhansali is the executive vice president, portfolio manager, and firm-wide head of analytics for portfolio management at PIMCO

Risk: A Study of Its Origins, History and Politics
By Matthias Beck and Beth Kewell
Summary via publisher, World Scientific
Over a period of several centuries, the academic study of risk has evolved as a distinct body of thought, which continues to influence conceptual developments in fields such as economics, management, politics and sociology. However, few scholarly works have given a chronological account of cultural and intellectual trends relating to the understanding and analysis of risks. Risk: A Study of its Origins, History and Politics aims to fill this gap by providing a detailed study of key turning points in the evolution of society’s understanding of risk. Using a wide range of primary and secondary materials, Matthias Beck and Beth Kewell map the political origins and moral reach of some of the most influential ideas associated with risk and uncertainty at specific periods of time. The historical focus of the book makes it an excellent introduction for readers who wish to go beyond specific risk management techniques and their theoretical underpinnings, to gain an understanding of the history and politics of risk.

Aid on the Edge of Chaos: Rethinking International Cooperation in a Complex World
By Ben Ramalingam
Summary via publisher, Oxford University Press
It is widely recognised that the foreign aid system – which today involves every country in the world – is in need of drastic change. But there are conflicting opinions as to what is needed. Some call for dramatic increases in resources, to meet long-overdue commitments, and to scale up what is already being done around the world. Others point to the flaws in aid, and bang the drum for cutting it altogether – and argue that the fate of poor and vulnerable people be best placed in the hands of markets and the private sector. Meanwhile, growing numbers are suggesting that what is most needed is the creative, innovative transformation of how aid works. Aid on the Edge of Chaos is firmly in the third of these camps.

Q4:2013 US GDP Nowcast: +2.9% | 1.03.2014

Last year’s fourth-quarter US GDP is expected to increase 2.9% (real seasonally adjusted annual rate), according to The Capital Spectator’s revised average econometric nowcast. The projected growth rate is substantial higher than the previous 2.0% estimate, which was published on December 9. The government’s initial estimate of 2013’s Q4 GDP is scheduled for release on January 30.

Although the current nowcast represents an improvement over last month’s projection, the Q4 GDP outlook of 2.9% growth still falls well short of Q3’s 4.1% increase, as reported by the Bureau of Economic Analysis last month. Nonetheless, economists advise that the macro outlook is improving, as suggested by yesterday’s upbeat reports on jobless claims and the ISM Manufacturing Index. “The underlying trends are pointing to the economy accelerating as we move through the year,” Joel Naroff, chief economist at Naroff Economic Advisors, tells Reuters. “Conditions seem to be coming together for a very good year.”

Here’s how The Capital Spectator’s current Q4 nowcast compares with recent history and several forecasts from other sources:

Next, let’s review the individual nowcasts:

gdp.b.03jan2014.gif

Here’s how the Q4:2013 nowcast updates compare so far:

Finally, here’s a brief profile for each of The Capital Spectator’s nowcast methodologies:

R-4: This estimate is based on a multiple regression in R of historical GDP data vs. quarterly changes for four key economic indicators: real personal consumption expenditures (or real retail sales for the current month until the PCE report is published), real personal income less government transfers, industrial production, and private non-farm payrolls. The model estimates the statistical relationships from the early 1970s to the present. The estimates are revised as new data is published.

R-10: This model also uses a multiple regression framework based on numbers dating to the early 1970s and updates the estimates as new data arrives. The methodology is identical to the 4-factor model above, except that R-10 uses additional factors—10 in all—to nowcast GDP. In addition to the data quartet in the 4-factor model, the 10-factor nowcast also incorporates the following six series:

• ISM Manufacturing PMI Composite Index
• housing starts
• initial jobless claims
• the stock market (S&P 500)
• crude oil prices (spot price for West Texas Intermediate)
• the Treasury yield curve spread (10-year Note less 3-month T-bill)

ARIMA GDP: The econometric engine for this nowcast is known as an autoregressive integrated moving average. This ARIMA model uses GDP’s history, dating from the early 1970s to the present, for anticipating the target quarter’s change. As the historical GDP data is revised, so too is the nowcast, which is calculated in R via the “forecast” package, which optimizes the parameters based on the data set’s historical record.

ARIMA R-4: This model combines ARIMA estimates with regression anlaysis to project GDP data. The ARIMA 4 model analyzes four historical data sets: real personal consumption expenditures, real personal income less government transfers, industrial production, and private non-farm payrolls. This model uses the historical relationships between those indicators and GDP for projections by filling in the missing data points in the current quarter with ARIMA estimates. As the indicators are updated, actual data replaces the ARIMA estimates and the nowcast is recalculated.

VAR 4: This vector autoregression model uses four data series in search of interdependent relationships for estimating GDP. The historical data sets in the R-4 and ARIMA R-4 models noted above are also used in VAR-4, albeit with a different econometric engine. As new data is published, so too is the VAR-4 nowcast. The data sets range from the early 1970s to the present, using the “vars” package in R to crunch the numbers.

ARIMA R-NIPA: The model uses an autoregressive integrated moving average to estimate future values of GDP based on the datasets of four primary categories of the national income and product accounts (NIPA): personal consumption expenditures, gross private domestic investment, net exports of goods and services, and government consumption expenditures and gross investment. The model uses historical data from the early 1970s to the present for anticipating the target quarter’s change. As the historical numbers are revised, so too is the estimate, which is calculated in R via the “forecast” package, which optimizes the parameters based on the data set’s historical record.

ISM Manufacturing Index: December 2013 Preview

The ISM Manufacturing Index is expected to increase marginally to 57.8 in today’s December update (scheduled for release this morning at 10:00 am New York time), based on The Capital Spectator’s average econometric forecast. The estimate compares with the previously reported 57.3 for November. Meanwhile, the Capital Spectator’s average projection is moderately above a trio of consensus forecasts for December via surveys of economists.

Here’s a closer look at the numbers, followed by brief summaries of the methodologies behind The Capital Spectator’s projections:

ism.02jan2014.gif

VAR-1: A vector autoregression model that analyzes the history of industrial production in context with the ISM Manufacturing Index. The forecasts are run in R with the “vars” package.

VAR-6: A vector autoregression model that analyzes six economic time series in context with the ISM Manufacturing Index. The six additional series: industrial production, private non-farm payrolls, index of weekly hours worked, US stock market (S&P 500), spot oil prices, and the Treasury yield spread (10 year Note less 3-month T-bill). The forecasts are run in R with the “vars” package.

ARIMA: An autoregressive integrated moving average model that analyzes the historical record of the ISM Manufacturing Index in R via the “forecast” package.

ES: An exponential smoothing model that analyzes the historical record of the ISM Manufacturing Index in R via the “forecast” package.

Major Asset Classes | December 2013 | Performance Review

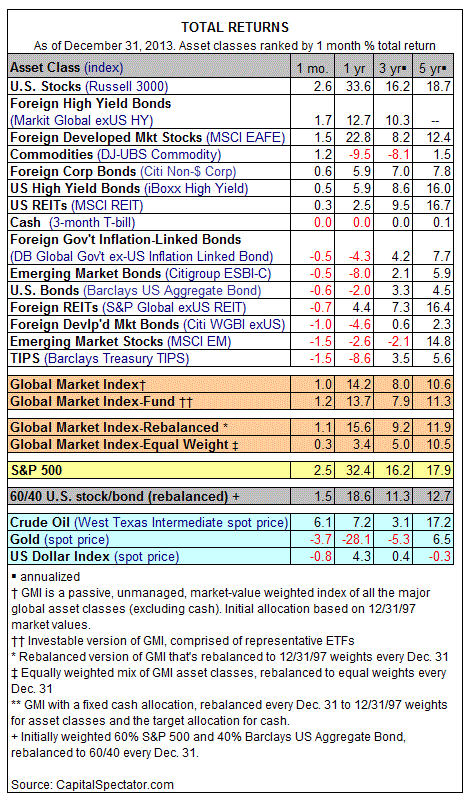
The year just passed delivered an unusually wide spectrum of results among the major asset classes. US equities were firmly in the lead, surging more than 30% in 2013. At the final bell for 2013, the biggest retreat was in commodities overall, which sunk more than 9%, based on the DJ-UBS Commodity Index.

In a year filled with an ample supply of surprising twists and turns, broad diversification remained competitive. The Global Market Index (GMI) was ahead last year by a bit more than 14%, dispensing a strong calendar-year performance and offering another reminder that outperforming Mr. Market’s asset allocation is as challenging as ever.

gmi.02jan2014.gif

For the lucky (smart?) few who managed to beat the odds, last year’s recipe for success came in two basic flavors: overweight developed-world stocks (US equities in particular) and/or go light on bonds. It’s anyone’s guess what 2014’s winning strategy will be. That doesn’t stop the pundits from offering advice. But before you go off the deep end and embrace a self-proclaimed oracle’s forecasts, ask yourself a simple question: How do his predictions from a year ago stack up today?

Speaking of predictions, here’s one that’s likely to stand the test of time: GMI’s performance in 2014 will remain above average when we tally the numbers a year from now vs. a broad span of actively managed efforts intent on generating superior results. History suggests that’s a relatively safe forecast, which implies that you need a hefty dose of confidence (or hubris) to move dramatically away from Mr. Market’s portfolio mix in the year ahead.

2014 Kicks Off With A Pair Of Upbeat Macro Numbers

The new year’s off to an encouraging start with economic news. Today’s updates on jobless claims and the ISM Manufacturing Index suggest that moderate growth was still bubbling in the final month of 2013. Although December’s macro profile is still largely a mystery, the numbers du jour imply that last year’s finale will compare favorably with recent history when the full set of data is published in the weeks ahead.

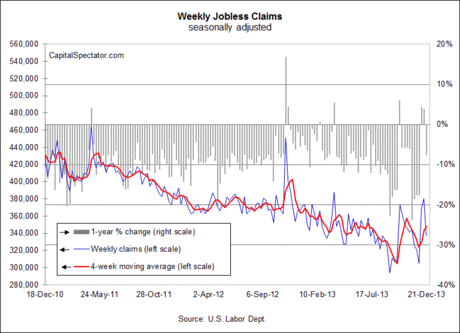
New filings for jobless claims inched lower again last week, dipping 2,000 to a seasonally adjusted 339,000 for the week through December 28. Although that’s still elevated compared with the post-recession low of 294,000 set back in September, claims are again falling. Today’s retreat is the second weekly decline in a row—a trend we haven’t seen since November. A more persuasive sign of optimism: claims fell last week by nearly 9% vs. the year-earlier level. For the moment, it appears that this leading indicator is again signaling that the labor market will continue growing for the near term. The warnings signs that we saw earlier this month for this series now looks like another false alarm.

Meantime, the manufacturing sector is humming along nicely, according to the latest report from the Institute for Supply Management. Although manufacturing growth for December was a bit softer than expected, the 57.0 reading for last month equates with a healthy rate of expansion (readings above the neutral 50.0 mark equate with growth). Keep in mind that the employment and new orders components in today’s ISM report posted slightly stronger numbers, suggesting that manufacturing’s growth is broad and deep.

The economy’s positive momentum has been conspicuous for some time, as recent history reminds. In last month’s update of the Economic Trend & Momentum indexes, business cycle risk remained low through November and the near-term projections imply that more of the same is on tap. Today’s twin updates certainly offer no reason to change that outlook. It remains to be seen if the year ahead will bring a stronger rate of jobs creation, but it’s a bit easier to think that’s a plausible scenario after looking at today’s numbers.

Yes, it’s been a good year so far for economic news.

And That’s A Wrap For 2013…

The year is fading fast and your editor is heading south for a short holiday. The usual routine will resume in the new year—Thursday, January 2, 2014, to be precise. But before we close the books on 2013, let’s take one final look in the rear-view mirror and stack up the major asset classes in terms of their year-to-date performance using a set of proxy ETFs that have been rebased to 100 as of Dec. 31, 2012.

As calendar years go, the one that’s currently winding down has been notable for dispensing a wide array of results. At the top (still) is the US stock market, which is up nearly 33% this year, based on the Vanguard Total Stock Market ETF (VTI). More than 40 percentage points lower is the year’s bottom performer: government bonds in emerging markets by way of the Market Vectors EM Local Currency Bond ETF (EMLC), which has slumped a bit more than 10% this year through Friday’s close. What does it all mean for 2014? The first installment on the answer arrives this Thursday. Meantime, Happy New Year!


gmi.29dec2013.gif

table.29dec2013.gif

Best of Book Bits 2013 (Part II)

Here’s the second installment to last week’s recap of The Capital Spectator’s short list of titles from 2013 that deserve another look. Each of the following reviews and summaries appeared earlier in the year on these pages. And now for an encore presentation….

Balance: The Economics of Great Powers from Ancient Rome to Modern America
By Glenn Hubbard and Tim Kane
Review via Publishers Weekly
Political paralysis leading to fiscal collapse is the “existential threat” facing America, argues this stimulating, contentious economic history. Economists Hubbard (dean of Columbia University’s Graduate School of Business) and Kane (chief economist of the Hudson Institute), both one-time advisers to the 2012 Romney-Ryan campaign, conduct a loose, engaging tour through history, pinpointing the economic failings of states from ancient Rome (debased currency, expensive bread and circuses, totalitarian labor controls) and Ming China (squabbling between court mandarins and eunuchs that scotched trade initiatives) to contemporary Europe and the United States (unsustainable government entitlements and debt). They frame the perennial debate over national decline in novel economic terms, ranking countries by a metric of “economic power”—GDP times productivity times the square root of growth—that puts America still uneasily on top.

Keeping Up with the Quants: Your Guide to Understanding and Using Analytics
By Thomas H. Davenport and Jinho Kim
Summary via publisher, Harvard Business Press
Welcome to the age of data. No matter your interests (sports, movies, politics), your industry (finance, marketing, technology, manufacturing), or the type of organization you work for (big company, nonprofit, small start-up)–your world is awash with data. As a successful manager today, you must be able to make sense of all this information. You need to be conversant with analytical terminology and methods and able to work with quantitative information. This book promises to become your “quantitative literacy” guide–helping you develop the analytical skills you need right now in order to summarize data, find the meaning in it, and extract its value. In “Keeping Up with the Quants,” authors, professors, and analytics experts Thomas Davenport and Jinho Kim offer practical tools to improve your understanding of data analytics and enhance your thinking and decision making.

When the Money Runs Out: The End of Western Affluence
By Stephen D. King
Summary via publisher, Yale University Press
The Western world has experienced extraordinary economic progress throughout the last six decades, a prosperous period so extended that continuous economic growth has come to seem normal. But such an era of continuously rising living standards is a historical anomaly, economist Stephen D. King warns, and the current stagnation of Western economies threatens to reach crisis proportions in the not-so-distant future. Praised for the “dose of realism” he provided in his book Losing Control, King follows up in this volume with a plain-spoken assessment of where the West stands today. It’s not just the end of an age of affluence, he shows. We have made promises to ourselves that are achievable only through ongoing economic expansion. The future benefits we expect—pensions, healthcare, and social security, for example—may be larger than tomorrow’s resources.

Exodus: How Migration is Changing Our World
By Paul Collier
Summary via publisher, Oxford University Press
In Exodus, Paul Collier, the world-renowned economist and bestselling author of The Bottom Billion, clearly and concisely lays out the effects of encouraging or restricting migration. Drawing on original research and case studies, he explores this volatile issue from three perspectives: that of the migrants themselves, that of the people they leave behind, and that of the host societies where they relocate. As Collier shows, emigrants from the poorest countries of the world tend to be the best educated and most ambitious. And while these people often benefit economically by leaving their home countries, they also drain these countries of the skills they so desperately need. In the absence of controls, emigration would accelerate: the poorest countries would face nothing less than a mass exodus. Ultimately the danger is that both host and countries of origin may lose their national identities — an outcome that would be disastrous, Collier argues, as national identity remains a powerful force for good. Migration must be restricted to ensure that it benefits both those countries left behind and those opening their doors.

Fortune Tellers: The Story of America’s First Economic Forecasters
By Walter A. Friedman
Summary via publisher, Princeton University Press
The period leading up to the Great Depression witnessed the rise of the economic forecasters, pioneers who sought to use the tools of science to predict the future, with the aim of profiting from their forecasts. This book chronicles the lives and careers of the men who defined this first wave of economic fortune tellers, men such as Roger Babson, Irving Fisher, John Moody, C. J. Bullock, and Warren Persons. They competed to sell their distinctive methods of prediction to investors and businesses, and thrived in the boom years that followed World War I. Yet, almost to a man, they failed to predict the devastating crash of 1929.

Strategic Briefing | 12.27.13 | Rising US Interest Rates

Treasury 10-Year Yield Rises to 3% on Fed Policy, Recovery Signs
Bloomberg | Dec 27
“The pace of the U.S. economic recovery means there’s room for the 10-year yield to rise further, perhaps towards 3.25 percent in 2014,” said Soeren Moerch, head of fixed-income trading at Danske Bank A/S in Copenhagen. “I don’t think it will go much higher from there. We expect the Fed to keep official interest rates low for another 18 to 24 months.”

US Treasury yields top 3% after Fed taper
Financial Times | Dec 27
But the recent rise in yields has come when economic data, particularly for housing, has been solid, seen as validating the decison of the Fed to taper QE.
“At this point it seems clear that the fear of higher interest rates hurting housing is overblown,” said Ajay Rajadhyaksha, co-head of FICC research at Barclays.
Also, in contrast with September, the bond market is not pricing in aggressive rate hikes. The December 2015 federal funds contract currently suggests the central bank’s overnight borrowing rate will be around 0.75 per cent at that date, well shy of its 1.50 per cent peak seen as recently in September when the market believed that a taper would be followed by a rapid pace of monetary policy being tightened.
“It’s difficult to make a case that 10-year yields will rise from here unless the market accelerates the tightening cycle,” said Mr Rajadhyaksha.

10-Year Treasury Yield Touches 3%
The Wall Street Journal | Dec 26
“The bond market will be fine if the rise in yields is orderly and slowly rising, with limited inflation,” said Kevin Giddis, head of fixed income at Raymond James in Memphis, Tenn. “The problems begin when you combine velocity and a spike in consumer prices.”

Treasury 10-Year Note Yields Reach Highest Level Since September
Bloomberg | Dec 26
“The economy is gaining strength; rates will go higher,” said David Coard, head of fixed-income trading in New York at Williams Capital Group LP, a brokerage for institutional investors. “We are in holiday mode right now, so markets are extremely thin.”

10-year Treasury hits key 3% level
USA Today | Dec 26
“If long-term interest rates rise too rapidly, we could see stronger headwinds develop in housing, autos and business spending, (which) could temper our optimistic economic outlook,” says Anderson. “Gradual rate increases that are matched by stronger sales, and improved investment opportunities are not as concerning as interest rates that are on the rise because the Fed is no longer a major buyer in the U.S. Treasury market.”

U.S. 10-year yield edges up near 3 pct on light trade
Reuters | Dec 26
If the 10-year Treasury yield, a benchmark for mortgage rates and investment returns, were to rise much above 3 percent, it might be a negative for stocks and other risky assets. A further rise in bond yields would push up long-term borrowing costs, taking steam out of the economic recovery — similar to what happened this past summer, analysts said.
“Other markets will take notice if we establish a foothold above 3 percent,” said Rob Zukowski, senior technical analyst at 4Cast Ltd in New York.

Macro-Markets Risk Index: 13.7% | 12.27.2013

The US economic trend has remained relatively stable and positive in recent weeks, based on a markets-based profile of macro conditions. The Macro-Markets Risk Index (MMRI) closed at 13.7% on Thursday, Dec. 26, a level that suggests that business cycle risk remains low. The current 13.7% value is well above the lowest reading for the year to date—7.5% in mid-September—and well above the 0% danger zone. If MMRI falls under 0%, that would be a sign that recession risk is elevated. By comparison, readings above 0% imply a bias for economic growth.

MMRI represents a subset of the Economic Trend & Momentum indices, a pair benchmarks that track the economy’s broad trend for signs of major turning points in the business cycle via a diversified set of indicators. Analyzing the market-price components separately offers a real-time approximation of macro conditions, according to the “wisdom of the crowd.” By contrast, conventional economic reports are published with a time lag. MMRI is intended for use as a supplement for developing perspective on the current month’s economic profile until a complete data set is published.

MMRI measures the daily median change of four indicators based on the following calculations:

• US stocks (S&P 500), 250-trading day % change, plotted daily
• Credit spread (BofA ML US High Yield Master II Option-Adjusted Spread), inverted 250-trading day % change, plotted daily
• Treasury yield curve (10-yr Treasury yield less 3-month T-bill yield), no transformation, plotted daily
• Oil prices (iPath S&P GSCI Crude Oil Total Return Index ETN (OIL)), inverted 250-trading day % change, plotted daily

Here’s how MMRI compares on a daily basis since August 2007:

Here’s a closer review of how MMRI stacks up so far this year:

A Timely Decline In New Jobless Claims

The encouraging economic numbers for the US in recent weeks have been marred by two sore spots: a sharp rise in new jobless claims and a worrisome deceleration in the growth rate for disposable personal income (DPI). But today’s release on new filings for unemployment benefits suggests that we have one less threat to worry about.

Jobless claims dropped by a hefty 42,000 last week to a seasonally adjusted 338,000. And not a moment too soon. Claims have surged recently, reaching the highest level since March for the week through December 14. But quite a lot of the increase was reduced in today’s report. As a result, claims have slipped to the lowest level since late-September. It’s still unclear if this leading indicator will resume the downward trajectory that was in force until a few months ago. But for today at least we have a new reason to think that the economy’s capacity for creating jobs at a modest pace is intact.

It’s especially reassuring to see the year-over-year trend in claims again reflect a decline after two straight weeks of increases. The change suggests that the jump in claims numbers of late have been tortured by short-term volatility of minimal relevance for reading the business cycle’s tea leaves.

But that leaves us to ponder the troubling weakness in the rate of growth for DPI. As I noted on Monday with regards to the November income report: “DPI’s annual change continues to slump, rising only 1.5% last month vs. a year ago. That’s a sharp deceleration from October’s 2.6% year-over-year rate. It’s also the second-slowest pace of growth this year.”

It’s unclear if this too is noise, or the start of something darker. Exhibit A for leaning toward the former assumption is the wide array of robust numbers across the macro spectrum. Indeed, the economic trend continues to reflect a low level of business cycle risk through November. The generally bubbly overview implies that DPI will again join the party. But that’s a purely speculative projection at this stage, and will remain so until we see more data on income, starting with the next update: the December report, scheduled for release on January 31.