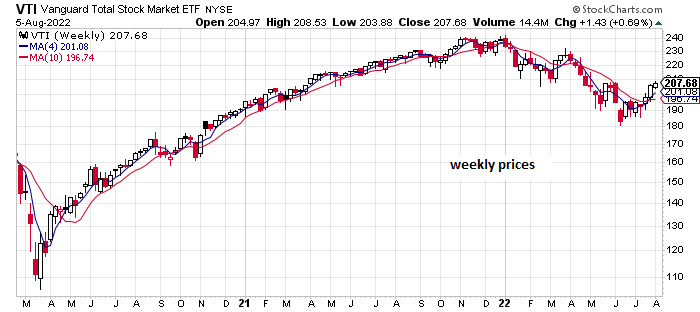
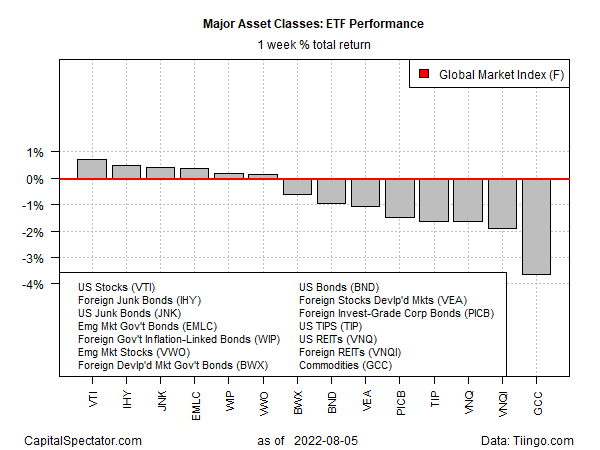
American shares rose for a third straight week in trading through Friday’s close (Aug. 5), posting the leading performance for the major asset classes, based on a set of ETFs. Commodities, by contrast, lost ground, suffering the deepest loss last week.
Vanguard US Total Stock Fund (VTI) rose 0.7%, closing just below its highest level in two months. The recent rally has prompted debate about whether the rebound marks the start of a new bull run or if it’s a bear market rally that will soon run out of steam.

“We are still of the view that we are witnessing a long and powerful bear market rally, and that the June low will be tested and surpassed, but it is always hard to differentiate between this phenomenon and the start of a new bull cycle from a technical perspective,” advise analysts at Marketfield Asset Management. “Both tend to feature rapid and broad advances, particularly among names that had become the locus of short selling. Wednesday, in particular, saw notable advances by a number of crowded shorts, suggesting that a significant amount of covering took place.”
Roughly half of the major asset classes rose last week, with the other half falling via relatively steep declines. Broadly defined commodities tumbled the most, based on WisdomTree Commodity Index (GCC), which lost 3.7%.
The Global Market Index (GMI.F) lost ground last week for the first time in the past three, edging down fractionally. This unmanaged benchmark, maintained by CapitalSpectator.com, holds all the major asset classes (except cash) in market-value weights via ETFs and represents a competitive index for portfolio strategy analytics.

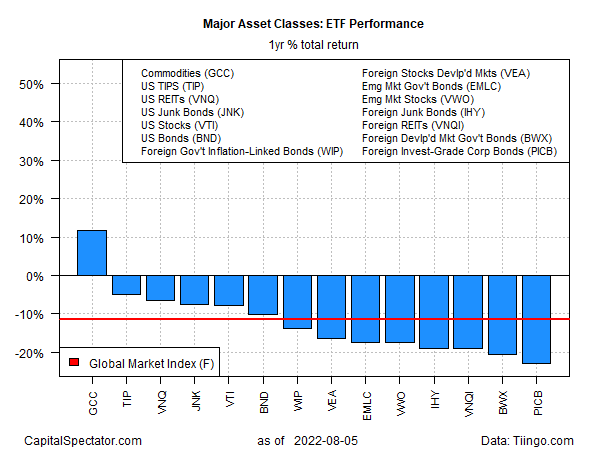
For the one-year return window, commodities are still the only slice of the major asset classes with a positive return, although the gain is fading. GCC is up a bit less than 12% over the past 12 months through Friday’s close.
The rest of the field remains deep in the red, with foreign corporate bonds (PICB) posting the biggest one-year decline – more than 20% below the year-earlier close after including distributions.
GMI.F has lost 11.3% over the past year.

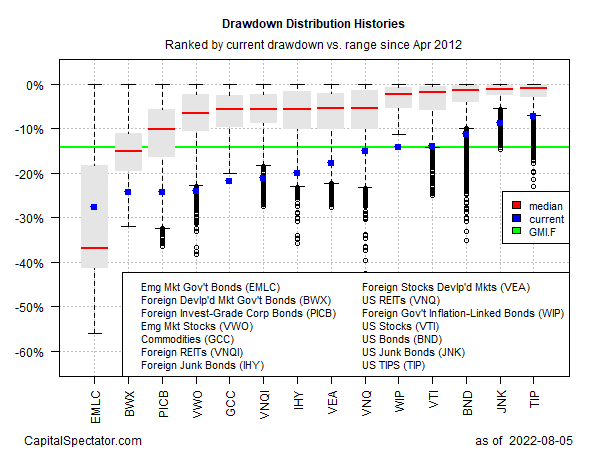
For drawdowns, all the major asset classes are posting peak-to-trough declines deeper than -10%, with two exceptions: US junk bonds (JNK) and inflation-indexed Treasuries (TIP).
GMI.F’s current drawdown: -14.2%.

How is recession risk evolving? Monitor the outlook with a subscription to:
The US Business Cycle Risk Report