The theory of peak oil remains as contentious as ever and by definition unresolved. The supporting evidence starts with the bull market in crude prices in recent years, inspiring some to proclaim that global production is about as high as it ever will be.
The optimists counter that technology will save the day, through new discoveries that offset declining production from aging fields and recovering more oil from older wells that would otherwise run dry.
The jury is still out on the big picture, and it may remain so for years. In the meantime, there is no shortage of data to review. Case in point: the reported peak (so far) in global crude oil production came in May 2005 at 74.3 million barrels per day (bpd), as our chart below shows, according to numbers from the U.S. Energy Information Administration. In fact, there’s been only three months when global production crossed above 74 million bpd, the latest one coming last October at 74.1 million bpd, or just below the May 2005 summit.
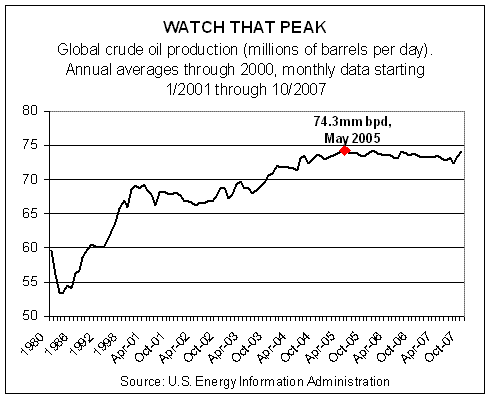
It’s any one’s guess if the old high will stand or not. And, of course, there are questions about the accuracy of EIA’s numbers. In fact, there’s skepticism regarding any database attempting to consolidate such an unwieldy beast as the world’s oil production into one number. Nonetheless, everyone will be watching the updates, eager to declare victory for their side. All the more so considering how close last October’s total was to the May 2005 apex. As we write, EIA’s monthly production figures run through October 2007; the November report is coming soon.
Meantime, as the world ponders the supply side of the oil market, there’s far less mystery on the demand side. In fact, it’s the same old story: up, up and away.
re WILL THE PEAK HOLD? I found your graph fascinating. I believe, however, it reflects only conventional crude production. World consumption is around 85 million barrels per day. The difference is made up by “unconventional” oil like the Canadian oil sands and liquids from natural gas production.
Marvin,
Yes, you are correct. I choose to focus on crude exclusively. Overall petroleum production is a bit higher, with the difference made up through gas to liquids, tar sands, and at times inventory drawdowns. But since the burning question centers on crude proper, I thought it best to look at this exclusively. Nonetheless, the complete petroleum profile is crucial too, if only to see how the system is coping. As such, I’ll soon be looking at the broader measure of petroleum production.