There’s been a lot of talk of bubbles lately, including speculation on where the next one lies. Some say it’s in the energy sector; others claim that gold’s a bubble. Here’s our nomination: bonds.
Our proxy for fixed-income is the ever-popular 10-year Treasury, the benchmark for U.S. debt markets and in some cases foreign markets too. Exhibit A in our bubble thesis is the chart below, which shows the daily closing yield of the 10 year for 40 years-plus through last night’s close. Restating the graphically obvious: the great decline in yield for the past 26 years. Since the peak of 15.84%, set on September 30, 1981, the 10-year Treasury’s yield has, with fits and starts, become a shadow of its former self.
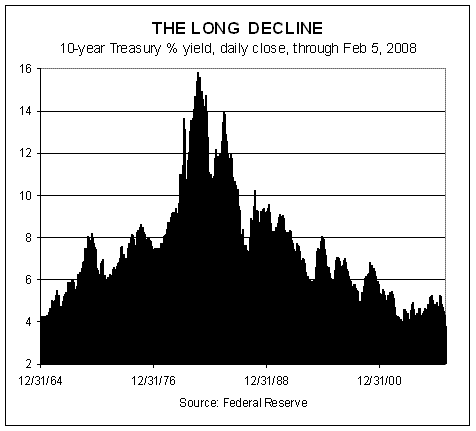
As of yesterday’s close, the 10 year trades at 3.61%–a tidy 1200 basis points below the 1981 summit. In fact, that’s not the lowest yield in recent memory. In June 2003, the 10-year yield briefly dipped to 3.20% (measured by daily closes) and 3.09% on an intraday basis. As we write, those troughs are theoretically just a few trading sessions away–if the bond market is willing.
So far, the fixed-income set has seen fit to follow the Federal Reserve down the slippery slope of fading rates. That’s unsurprising, given that falling rates are the fuel that’s lifted bonds to the upper levels of the performance horse race among the major asset classes. No wonder, then, that bonds generally have been faring well recently in relative and absolute performance terms. The iShares Lehman Aggregate Bond ETF (AGG), for example, boasts a 2.5% total return so far this year through yesterday and 8.9% for the past 12 months. Inflation-indexed Treasuries and foreign bonds in developed markets, along with the broad commodity indices, have done even better over those time frames. Otherwise, lesser performance and red ink prevail among the major asset classes.