After a summer of drifting lower and then holding in a range, the benchmark 10-year US Treasury yield is running higher this month. Does the jump mark a regime change after decades of trending lower? Or is this one more bout of noise? No one can be certain one way or the other, but we can and should manage our expectations by looking a variety of sources for perspective.
Perhaps the best way to start is by considering the economic climate and on that front one variable that’s different this time is inflation, which has been running hot lately. It’s still an open debate if the jump in inflation is temporary or the start of a sustained period of higher pricing pressure. If it turns out to be the latter, the evidence will lean heavily in favor of seeing a higher 10-year rate as a sign that there’s more signal than noise at work.
Higher energy prices are certainly playing into the higher inflation narrative, which in turn promotes the case for expecting central banks to shift to a tightening bias for monetary policy for the foreseeable future.
“It’s quite clear that a global hiking cycle had already started before the recent mini energy crisis. Will this renewed spike in energy costs mean central banks accelerate this … or will it hit demand enough that it actually slows them down? This is an incredibly delicate and difficult period for central banks,” advises Deutsche Bank’s Jim Reid in a note to clients.
Learn To Use R For Portfolio Analysis
Quantitative Investment Portfolio Analytics In R:
An Introduction To R For Modeling Portfolio Risk and Return
By James Picerno
The question is whether the ongoing downshift in economic growth will take the edge off inflation’s momentum? As discussed last week, current data for third-quarter GDP growth remains strong, but nowcasts continue to show softer estimates through time.
Meanwhile, inflation appears to be peaking, but it’s unclear if the peak will extend out in time and leave pricing pressure elevated for a longer run than we’ve seen in recent decades.
The path of the pandemic in the fall and winter will also play a big role in determining if the economy slows faster than expected, or not. In turn, that outcome will cast a long shadow on inflation.
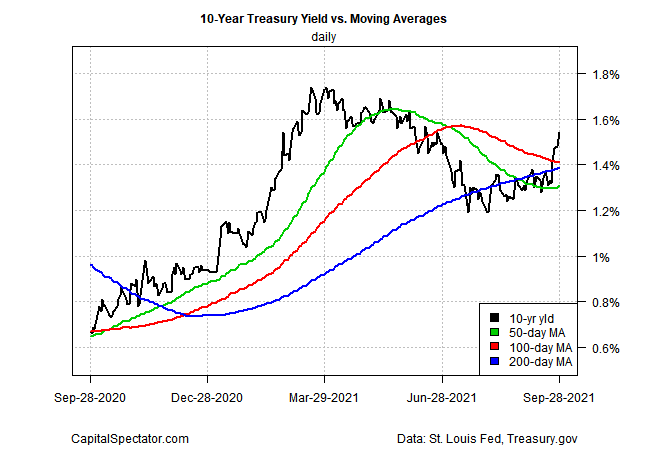
The near-term outlook, in short, remains fluid, perhaps more so than usual. While we’re waiting for more numbers to clarify macro conditions, let’s put the 10-year rate into perspective from four angles, starting with a set of moving averages. As the first chart below shows, the 10-year yield has popped well above its 50-, 100- and 200-day averages, which suggests there’s more upside ahead.
For another spin, consider how changes in the 10-year rate compare over a rolling 50-day window since 2000. On this score, there’s still room to see the latest increase as normal volatility.

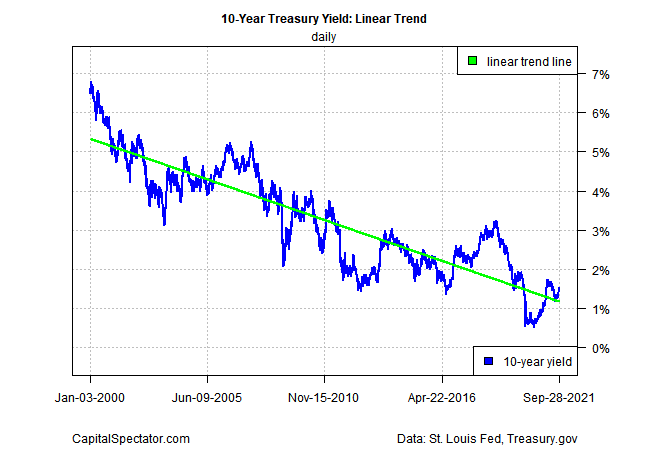
Looking at the 10-year rate relative to its trend since 2000 also suggests that the rise in yield so far isn’t unusual and that we’re still a long way from an outlier event.
Finally, estimating “fair value” via the average of three models implies that the 10-year yield should be near the 2% level, moderately higher than the current 1.54%.

Overall, the charts above suggest that the 10-year rate isn’t likely to test its recent bottom any time soon, short of a new recession, which doesn’t look likely at the moment.
“Markets are re-evaluating the outlook for monetary policy going forward,” says Andrew Pease, global head of investment strategy at Russell Investments. “There is a bit more upside for yields going further, and I think we’re in the process of re-normalizing those longer ends of yield curves.”
How is recession risk evolving? Monitor the outlook with a subscription to:
The US Business Cycle Risk Report