In the previous post on using R for portfolio analysis and design, we discovered that global diversification across asset classes has been modestly beneficial relative to a basic 60%/40% US stock/bond allocation. The global aspect didn’t add a lot of value because US equities during the sample period—from 2004 onward—generally delivered strong results, particularly over the last five years. But the future may not be so kind to a US-centric portfolio and so it’s reasonable to wonder if global diversification may be more productive in the years ahead. On that note, if we’re holding an international portfolio across asset classes, what are the possibilities for managing risk with a more aggressive process vs. a simple rebalancing program? As one possibility, let’s consider how a momentum-factor model compares vs. the basic rebalancing strategy. As a preview, this backtest looks quite encouraging for keeping drawdowns to a minimum while capturing the bulk of the upside returns via staying fully invested in the asset mix.
The strategy of using momentum as a signal for measuring/managing risk has been widely studied. The inspiration in this test draws on a wide array of papers, including the widely cited research by Meb Faber (“A Quantitative Approach to Tactical Asset Allocation”). Faber’s analysis shows that a global asset allocation strategy that integrates momentum (based on a 10-month moving average) generates superior risk-adjusted performance across the decades relative to the same portfolio that’s simply rebalanced with a conventional set of rules, i.e., back to the target weights but otherwise stay fully invested. The results below offer a similar result.
For the analysis here, I’m using the same mix of funds and target allocation from the previous post (for details, see “Adding A Global Strategy”). I’m comparing the results with a 60/40 US stock/bond mix. The twist this time is managing the global portfolio as follows:
Stay fully invested (per the initial target allocation that’s allowed to drift with market fluctuations) if the current 10-day moving average for the asset is above the 200-day average; otherwise, go to cash (assume 0% return) for that asset until a new buy signal is generated.
A couple of housekeeping notes before we look at the results. First, I’m using split-adjusted closing prices in this test rather than the total-return adjusted data in previous posts. Why? Because we want to replicate as closely as possible the results that were available using the price-based signals that were available in real time during the sample period. In addition, it’s important (as always) to use one-day-lagged momentum signals to avoid look-ahead bias.
Here’s how the momentum-based risk management strategy fared vs. the year-end rebalancing and buy-and-hold portfolios for the period Oct. 19, 20014 through Mar. 13, 2015. (Why the odd start date? It’s a reflection of the fact that we need trailing data to generate 200-day moving averages and so for an apples-to-apples comparison that’s where we begin for all three strategies.) Again, keep in mind that all of the portfolios are initially allocated to the same 11 funds in the same weights. But as you can see, the results vary due to differences in managing the asset mix through time. In particular, note the superior (and smoother) results in the 10-day/200-day moving average strategy (10-200 MA), as shown by the black line. The big advantage was avoiding the bulk of the 2008 crash, which is a byproduct of letting the momentum signals determine the risk exposure for each asset class.
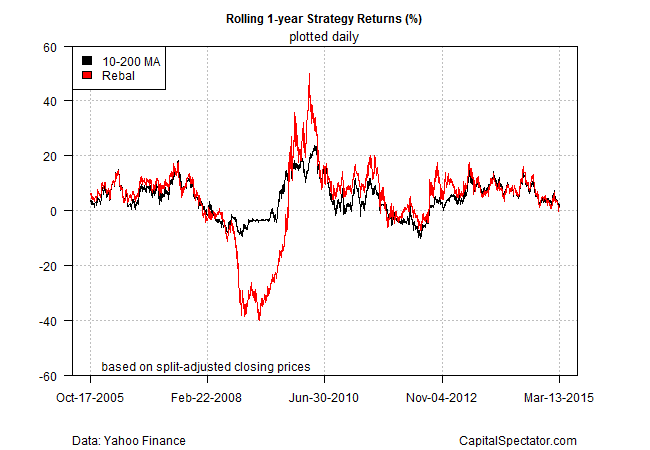
For a clearer look at the differences in return, let’s focus on rolling one-year performance for the momentum-based strategy vs. the year-end rebalanced strategy. As you can see, managing risk via momentum (black line) reduces the return dispersion quite a bit during periods of extreme volatility, delivering a smoother ride through time. Otherwise, the year-over-year performance between the two strategies tends to be similar. But just as the momentum portfolio suffers less during periods of extreme losses, the gains are smaller as well in those rare stretches when the market’s red hot.
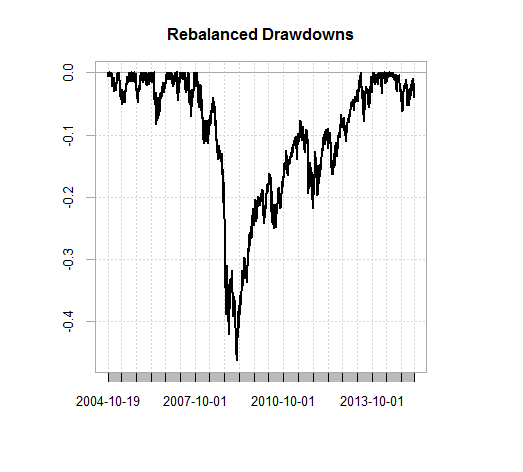
Next, let’s consider how the top-5 drawdowns compare, starting with the year-end rebalancing strategy. As the first table below shows, rebalancing every Dec. 31 back to the target weights was no panacea, as the steep 46% drawdown during the financial crisis in 2008-2009 reminds:
Top-5 Drawdowns: Rebalanced Strategy
        From     Trough         To   Depth Length To Trough Recovery
1 2007-11-01 2009-03-09 2013-05-21 -0.4629   1397       339     1058
2 2006-05-10 2006-06-13 2006-10-16 -0.0823    111        24       87
3 2013-05-22 2013-06-24 2013-10-17 -0.0783    104        23       81
4 2007-07-16 2007-08-16 2007-09-27 -0.0706     53        24       29
5 2014-06-20 2014-10-16       <NA> -0.0614    185        83       NA
Here’s a graphical recap of the rebalanced strategy’s drawdowns for the sample period:
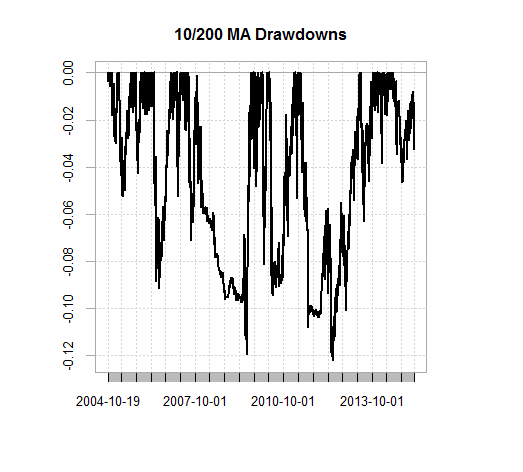
Next, let’s consider the drawdowns for the momentum-based strategy. As the table below shows, the corrections are dramatically smaller—the worst drawdown was a relatively light 12.2%:
Top-5 Drawdowns: Momentum Strategy
        From     Trough         To   Depth Length To Trough Recovery
1 2011-05-03 2012-06-04 2013-05-06 -0.1221    505       275      230
2 2007-07-16 2009-07-08 2009-08-27 -0.1195    536       500       36
3 2010-04-15 2010-05-26 2011-02-16 -0.0943    214        30      184
4 2006-05-10 2006-07-17 2006-12-04 -0.0914    145        47       98
5 2010-01-15 2010-02-08 2010-03-17 -0.0812     42        16       26
Here’s a graphical review of the momentum strategy’s drawdowns:
The results aren’t terribly surprising. Many studies show that adding a momentum-based risk-management system to a portfolio can enhance results, mainly by reducing risk. (For a good overview, including lots of references for deeper study, you might start with Gary Antonacci’s “Risk Premia Harvesting Through Dual Momentum”.)
But let’s be clear: managing risk on a portfolio-wide basis with momentum isn’t a free lunch. The price for lesser risk includes higher turnover and trading costs, which means a higher tax burden for taxable accounts. The results above conveniently ignore all of those frictions, along with slippage costs that inevitably come into play when buying and selling funds in the real world. There’s also the standard caveat that the encouraging results in the past may not show up in the future, although that’s true for every strategy. And over long periods, a risk-managed portfolio may trail a comparable buy-and-hold mix in terms of raw performance. In addition, the results in favor of momentum are a function of relatively extreme conditions due to the dramatic market declines of 2008-2009. Momentum’s benefits are reduced considerably if we exclude that period and focus on periods when market volatility is “normal.” One other issue to consider: diversification. The odds are higher for generating superior results with a momentum-based risk management when using a relatively broad mix of assets with comparatively low/negative correlations.
Despite these issues, there’s a strong case for harnessing the momentum factor in some degree for managing risk, if only because one never knows when another event is about to strike. The challenge is designing a system that’s appropriate for investment goals, risk tolerance, etc. The simple parameters outlined above are hardly an optimal solution. Rather, the goal here is to use a simple set of rules to highlight the value of using momentum as the basis for risk management. A real-world strategy would require deeper analysis and a more nuanced model–adding a position-sizing aspect to the portfolio, for instance.
The good news is that there’s a wide array of customization possibilities for building a strategy that’s closely aligned with your investment objectives. The key variables include the selection of funds and the details of the asset mix. The choices above are hardly the last word, but they provide a sense of what’s possible.
The bottom line: it’s hard to ignore momentum’s power. It comes in many flavors, of course, and so the details matter a lot in this corner. Nonetheless, there’s a basic lesson here: effectively managing risk will likely be tougher if you ignore the momentum factor.
* * *
Previous installments in this series:
Portfolio Analysis in R: Part I | A 60/40 US Stock/Bond Portfolio
Portfolio Analysis in R: Part II | Analyzing A 60/40 Strategy
Portfolio Analysis in R: Part III | Adding A Global Strategy


By the way, not sure if you’ve seen it yet, but R’s rolling performance function is needlessly slow. I’m coming out with a reporting package that will allow such computations to be done much faster.
-Ilya
Looking forward to the upgrade. Seconds can feel like hours when you’re moving through the data jungle, and so quicker is always better. Keep us updated!
Pingback: The Whole Street’s Daily Wrap for 3/16/2015 | The Whole Street