Red ink on the government’s ledger may not be the topic du jour, but it’s destined for greater scrutiny by Mr. Market. The timing and the relevance is an open debate. Meantime, the dollar value of America’s future promises (primarily Medicare/Medicaid and Social Security) continues to rise. As your editor details in the current issue of Wealth Manager, the prospective deficit born of all future government promises stands at a staggering $64 trillion, according to one estimate. That’s several times larger than last year’s GDP of $13 trillion-plus. On the other hand, $64 trillion comes with several caveats, starting with the fact that it’s calculated as the total long-run claim for the infinite future that’s facing the federal government less the anticipated tax revenues. The sum also assumes a corporate-style accounting system for assessing the future financial demands on the government. Such a system, however, doesn’t really apply to Washington. Or does it? In any case, no one will be shocked to learn that the dire projection for debt noted above is far from universally accepted, which leaves a wide variety of predictions as to just how much red ink awaits. Regardless of your view, the details are worth reviewing if only as a starting point for debate and education. If you’re game, you can dive into the particulars here….
Monthly Archives: August 2007
THANK YOU, SIR, MAY I HAVE ANOTHER?
The rejuvenating effects from the shot of monetary adrenaline are fading. The surprise cut in the Discount rate on August 17 gave the patient a lift, but it looks like another dose is needed. In fact, it would come as no great shock to learn that increasingly larger dosages will be required for comparable if not diminishing results.
The futures market expects that more liquidity is imminent. Fed funds futures are now priced in anticipation for a 25-basis-point cut. The prospect of lower rates hasn’t been lost on forex traders, who have been selling the dollar with renewed gusto this month. Inspired by the outlook for lower rates, the U.S. Dollar Index looks set to challenge its previous intraday low from early August. If that floor gives way, the index will sink to lows unseen in more than a decade.
Meanwhile, the Fed continues pumping up the money supply at a healthy clip, as our chart below observes. M2 money supply was running higher by 6.3% on an annual basis for the week through August 13. By comparison, nominal GDP growth was pegged at roughly the same pace of 6.2% for the second quarter, based on an annual seasonally adjusted pace.

The question is whether the economy is poised to slow considerably, in which case a 6% rate of increase in money supply will look considerably higher in relative terms. Tomorrow’s update on Q2 GDP may throw out a few clues, although the official number for Q3 won’t be known for some time. That leaves no choice but to scratch around for signs in the lesser numbers about what comes next on the macro scene in the months and quarters ahead.
Judging by the bond market’s review of affairs, one can reason that a slowdown of some degree is coming. To be sure, the bond ghouls have been wrong before and there’s no guarantee that the fixed-income set’s forecasting powers are intact now. That said, the 10-year Treasury yield sunk to 4.53% yesterday, the lowest in more than a year. Right or wrong, the bond market foresees a rate cut and a sharp slowdown in GDP growth in the second half of this year and perhaps into ’08.
The stock market seems of a similar mind. The S&P 500 closed down 2.4% yesterday, erasing most of the bounce dispense by August 17 cut in the Discount rate.
Liquidity has been the solution in recent years to keep the economy humming. No less will be required going forward. So far, the liquidity boost has looked like a free lunch. But strategic-minded investors may see some value in taking a fresh look at the question of whether a free lunch can stay free indefinitely. As always, there’s a variety of opinion but only one answer.
WHEN DOES A YIELD BECOME “HIGH”?
At what point does junk start to look like diamonds in the rough?
There’s no clear answer, but it’s a topical question whenever a financial squall blows through the capital markets and risk is repriced. It’s clear that we’ve suffered a storm of late, but it’s debatable if risk has been repriced on a dramatic scale.
Risk, for purposes of this post, is defined as the spread in high yield bonds over 10-year Treasuries. By that measure, junk commands a premium of 4.37% over the 10-year as of Friday’s close, as per Citigroup High Yield Index over Treasuries. The 4%-plus is significantly higher than the 2.6% spread offered by Mr. Market at the end of June, as our chart below shows. But while the rise looks impressive in the context of recent history, it’s still debatable on whether it also looks compelling enough to commit fresh capital to the asset class.
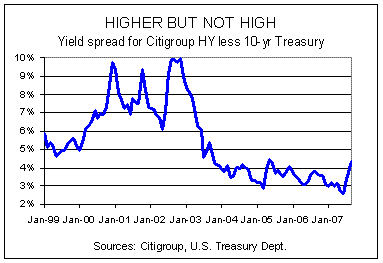
Deciding if junk’s spread now looks rich enough to compensate for risk depends on one’s confidence in the future. For those who believe that the economy will continue growing at a healthy if not necessarily exciting pace well into next year, the prospect of earning 400-plus basis points over Treasuries may entice. Indeed, the current spread is the highest in more than two years. And 400 basis points of additional yield is nothing to sneeze at when compounded over, say, a decade.
SO FAR, SO GOOD…MAYBE
The stock market’s calmer, but the jury’s still out on what the mortgage mayhem means for the economy. So far, however, there’s scant sign of trouble in the numbers.
Yesterday’s report on initial jobless claims, for instance, offered more of the same of late, which is to say that a middling performance remains the status quo. For the week through August 18, new filings for unemployment insurance actually slipped by 2,000 to 322,000, which is virtually unchanged from a year ago. There may be great drama unfolding in the capital markets, but yawns still dominate analysis of employment’s leading indicators.
Of course, this may be the calm before the storm for the economy. Morgan Stanley’s chief U.S. economist, Richard Berner, told The Wall Street Journal in a story published today that economic trouble is brewing, even if it’s not yet obvious. He predicted that “the housing downturn is going to be more prolonged and deeper than people might have imagined.”
WATCHING, WAITING & NIBBLING
It’s probably too soon to decide if the market tsunami has past or is just taking a breather. But it’s not too soon to start assessing the damage among the major asset classes.
As always, such surveys are a mix of looking at the past but with the hope of finding clues about what’s coming. Indeed, future returns are minted from events in the present. Of course, recognizing that is only the first step in a long strategy journey, which is why we keep turning over rocks wherever we find them. Most of the time the effort’s for naught. But if there’s ever a chance to mine intelligence about prospective returns, the opportunity may be highest directly following periods of extreme stress in the capital markets.
That’s just another way of saying that in the rare cases when prices and valuations move to excess, the actions modestly elevate the clarity about future returns and risks. Or so history suggests.
With that in mind, how have the major asset classes fared in recent weeks? As our table below suggests, the answer can be summarized by the central principle of the capital asset pricing model: risk matters. Higher risk has been a costly attribute in recent weeks. Cash, a realm where risk is minimal, was the best performer in the past four weeks. In contrast, asset classes with higher risks have lived up to their profile by dispensing higher losses.
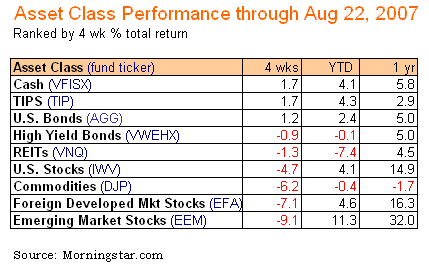
High returns are the other facet at times of high risk, as the past five years remind. But the tables have turned this summer, although that’s hardly an extraordinary or unexpected change for anyone who understands the CAPM-inspired notions of risk and reward.
ONE PHOTO’S WORTH A THOUSAND QUESTIONS
The photo op didn’t help.

Bernanke meeting yesterday with Sen. Dodd and Treasury Secretary Paulson
There’s much debate about how to proceed on monetary policy, but on at least one basic point there can be no argument: history clearly shows that central banks must be independent if they’re to be effective stewards of a nation’s currency. Simply put, the political factor has no place in central banking. Yes, it leaks in from time to time, but every effort should be made to keep it at arm’s length. The issue is more than window dressing. A large body of evidence shows that central banking works better when the political influence is reduced, ideally to zero.
With that in mind, a central bank’s independence flows from two fonts of power and influence. Ultimately, one is at risk when the other’s threatened, or is perceived to be threatened. The first is the fundamental autonomy that’s driven by the opportunity to weigh decisions based solely on the economics, i.e., monetary decisions that are unbound from the political aura that otherwise informs government action. The second source of a central bank’s authority and efficacy is what one might call soft power: the ability to shape perceptions in the market by tools other than the hard power of changing interest rates, adjusting money supply, etc. Giving speeches, for instance. Soft power draws heavily on the prevailing pool of respect for the central bank and a belief in its integrity for effecting change based on the economic merits. And the market’s belief in that integrity relies in no small part on the assumption that the Fed’s impervious to the political winds du jour.
CLUESS IN EQUITIES?
Relative tranquility returned to equity trading yesterday. The S&P 500 moved within a fairly tight range on Monday relative to recent history and closed down by only a small fraction vs. Friday. That’s progress next to last week’s turmoil: yesterday’s session was calm, cool and…clueless.
Clueless? Yes, if you were judging sentiment by what unfolded in the credit markets yesterday. In particular, a heightened state of fear gripped trading on the short end of the maturity spectrum. With a growing penchant to kick anything of less-than-stellar credit quality, investors rushed to safety by purchasing Treasury bills, the ultimate zone of security among paper assets. In the process, commercial paper of questionable quality took it on the chin.
The net result: the 3-month T-bill yield fell to around 3.12%, down from 3.76% on Friday’s close according to U.S. Treasury numbers. The commensurate rise in the price of a 3-month T-bill yesterday (bond prices move inversely to yields) has been widely reported as the biggest since the 1987 stock market crash. Even more striking is the fact that as recently as late July, 3-month T-bills yielded more than 5%.
CHOOSE WISELY
Take your pick: inflation or recession. Or, if your outlook is especially surly, perhaps you’ll opt for choice three: a bit of both, otherwise known as stagflation.
We’re not sure which one will prevail and, unfortunately, neither does the central bank. If pressed, our prediction is one of modestly slower growth, which might take the edge off inflation without derailing the economy. The lesser of several evils, if you will. But is that just wishful thinking? Who knows? In times like these, when well-founded assumptions about the morrow fold like cheap cameras, one has to take predictions with an increasingly skeptical mindset. And why not? That’s the nature of the future: it’s unknown, leaving investors, central banks, butchers and bakers with the unpleasant task of guessing, or forecasting, as it’s called in civilized conversations.
But no matter what you call it, the Federal Reserve has no choice but to indulge in it, for better or worse. Even under the best of circumstances, divining the future so as to reverse engineer an informed monetary policy today is a job with more than a trivial dose of risk. With disinflationary winds blowing hard in recent years, the job has looked easy in hindsight. But the jig is up and a far more complicated and risky climate has imposed itself on the business of central banking. Volatility has returned with gale force winds in some corners of the capital markets. The Fed has only a supply of blunt weaponry to battle the storm, but one makes due with the arsenal at hand.
VOLATILE OPPORTUNITIES
These are the times that try investors’ souls, pinch their wallets and raise questions about what constitutes sound thinking on investment strategy.
No, we don’t have definitive answers, but we can at least take a stab at dispensing some perspective, albeit informed by limited information that afflicts the mortal senses. With that caveat out of the way, perspective starts with the fact that volatility, as much as it scares us, is a good thing for strategic-minded investors. And the market has been nothing of late if not volatile.
The VIX index, a measure of S&P 500’s price volatility, has taken wing in recent weeks, effectively tripling from its close at the end of last year, as the chart below illustrates. Dramatic as the new trend is, the resurrection of risk isn’t all that surprising.
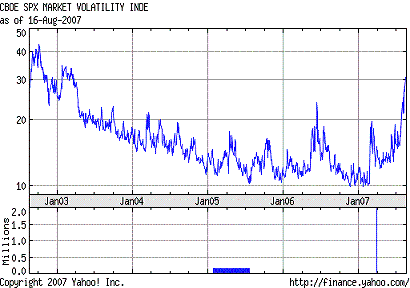
This past January we asked: Is Volatility Set for a Comeback? At the time, pondering a future of revived risk was widely dismissed as misguided ramblings. The bulls, you may recall, were then basking in a rare state of total control over asset classes. Everything had been rising for five years or more, and in the process price volatility fell sharply. The markets, in short, were priced for perfection, as they say. The fact that the perfection came after five years of fun suggested that it was time to prepare for something else. The timing and catalyst that would usher in change were still mysteries in January 2007. But the future seemed clear for those who believed that risk can’t stumble and stay abnormally low forever.
ANOTHER DISCOURAGING REAL ESTATE REPORT
A number of dismal scientists and market strategists have been advising for some time that the real estate market was set to stabilize. It wasn’t poised to grow necessarily, but that was just fine as far as the broader economy was concerned. The prediction fit nicely with the idea that if real estate simply stopped being a drag on the GDP calculation, the second half of 2007 into early 2008 would look pretty good in terms of growth.
That may yet prove accurate. But after reading this morning’s news on housing starts for July, new doubts arise about the momentum of real estate’s correction and, by extension, GDP’s prospects in the second half.
The Census Bureau reported today that housing starts dropped again last month, falling 6% from June, on a seasonally adjusted annualized basis. More dramatically, July’s 1.381 million annualized starts are down 21% from a year ago, as our chart below shows. Permits issued for new private housing construction is also off sharply on a monthly and annual basis through July.
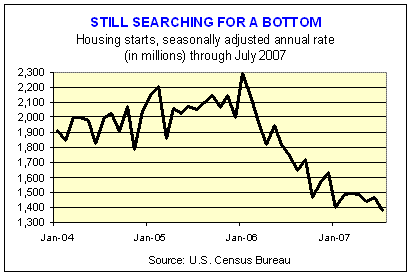
The housing starts and permits trends suggest that the pain continues. Until and if the numbers show some stability, there’s reason to expect more of the same, namely, declines. That may or may not be the right thing to do, but short of knowing the future, what else can a prudent investor to do these days?