It’s all about employment now. More of it would be better, although we may have to settle for losing it a slower pace for a bit longer.
The U.S. Labor Department will dispatch the official update for September nonfarm payrolls on Friday. Meantime, dismal scientists, pundits and fans of macabre labor stats are making estimates and crunching the numbers on hand.
Wanted Technologies, an employment analytics firm, expects that nonfarm payrolls will fade by 167,000 in September. If so, that would be an improvement over August’s loss of 216,000 jobs, albeit a relative improvement.
Monthly Archives: September 2009
STRATEGIC PERSPECTIVE IS (STILL) A RADICAL IDEA
Investment advice runs the gamut in the known universe of finance. Some of it’s good, some of it’s less so, but the majority of it is just plain misguided if not detrimental to the long-term interests of investors. It’s an old story, but it’s also a perennial, and therein lies the problem for most people trying win (or at least not lose) in the money game.
The central challenge for the average investor, perhaps even the average institutional investor, is that the global capital markets are rife with complication, short-term noise, nuance and lots of trap doors. Adding to this burden is the fact that much of what passes as investment intelligence is anything but, mainly because it lacks perspective and basic understanding of the essential business of portfolio design: risk management. There are simply too many “experts” running around dispensing advice to buy this, avoid that and otherwise recommend that investors engage in an ill-advised effort to second-guess market prices at every turn.
Yes, there are some who can beat markets, but it’s the rare individual investor who excels in picking securities across multiple asset classes. We take a different view in the monthly issues of The Beta Investment Report. Instead of starting from the belief that we have full clarity on the future path of risk and reward for the global capital and commodity markets, we assume that a fully diversified portfolio of all the major asset classes, weighted by the market values, is a robust benchmark from which to begin analysis and ultimately tweak Mr. Market’s passive allocation to suit our financial needs.
A SETBACK FOR DURABLE GOODS ORDERS
If you’re looking for a measure of the challenge that awaits, new orders for durable goods are a useful place to start.
Durable goods are arguably at the front line of economic activity. Purchasing big-ticket items, like cars and aircraft, take some degree of confidence in the near-term economic outlook as well as one’s personal (or corporate) financial condition. In times of economic distress, delaying such purchases is tempting. You can always buy a car next month.
WILL THE POSITIVE MOMENTUM SPREAD?
The update on new fillings for unemployment benefits is cheery once again, at least in trend if not absolute numbers. Initial jobless claims dipped to 530,000 last week, the lowest since mid-July and sharply below the peak for this cycle—674,000 for the week through March 28, 2009.

The downward trend suggests that the recession is over, but we’re still waiting for some corroborating support, including continuing claims, which remain elevated. The implication: businesses are laying off fewer workers (initial claims) but those who are already receiving jobless benefits aren’t finding work (continuing claims).
POLITICS & INVESTING DO MIX…EXCEPT WHEN THEY DON’T
Studying the election cycle and the stock market isn’t new, but that doesn’t stop inquiring minds from taking a fresh look at the numbers. CXO Advisory Group offers yet another perspective, albeit with middling results. As this research concludes,
“..there appear to be both long-term and short-term connections between the U.S. national election cycle and stock market performance, with presidential term year 3 (1) the best (worst) and a tendency for a brief election-time rally. However, the subsamples for presidential term year analysis are very small, so confidence in related tendencies is very low.”
Meanwhile, a popular research paper from recent history advises that “the excess return in the stock market is higher under Democratic than Republican presidencies.” Of course, that was from the vantage of 2003. Will the trend hold over the remaining years for the present incumbent? Based on the year-to-date returns so far, one might argue in the affirmative. But with the election more than three years away, a touch of modesty might still be in order.
SEI came to a similar conclusion last year, writing in a research note that “one year following [an] election, the average return of the DJIA was 2.18%. Here, the advantage goes to the Democrats, who averaged 5.43%, with the best year credited to Franklin D. Roosevelt, at 29.96% in 1944. Roosevelt also had the most negative return here; -28.68 during the first year of his first term in 1936. The average during the 9 Republican administrations was -1.07%.”
Of course, some think there’s enough of a challenge in predicting election outcomes alone without muddying the waters with adding stock market predictions to the game. If you’re of a similar persuasion, Professor Ray Fair of Yale is your man. As one of the leading academics parsing the finer points of forecasting elections, he’s well versed in the opportunities and limits of quantitative analysis and politics.
CORRECTION: INFLATION EXPECTATIONS AREN’T A CONSTANT
In our previous post today we mistakenly wrote that inflation expectations were constant. Twenty lashes for your editor. We meant to say that inflation expectations, along with the reported level of inflation, are constantly bouncing around, as any review of the historical record will show. We’ve updated the offending passge. Sorry.
INFLATIONARY PERFECTION
The Treasury market’s inflation forecast has remained fairly steady since May, hovering in the 1.5% to 2.0% range. As of Monday’s close, the current outlook for inflation is 1.80%, based on the yield spread between the nominal 10-year Treasury less its inflation-indexed counterpart.
As our chart below shows, this stability follows a period of extreme volatility, launched last September when the implosion of Lehman Brothers sparked a steep wave of selling in almost everything, government bonds being the leading exception.
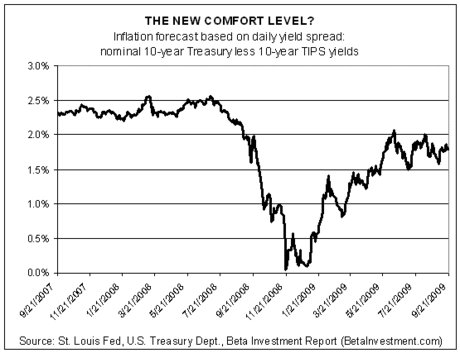
The Treasury market’s 1.8% inflation outlook contrasts with the most-recent 12-month change in the headline consumer price index, which dropped 1.5% for the year through August. But if we look at core CPI, which excludes the volatile energy and food sectors, prices rose by 1.4% for the 12 months through last month. That’s just under the 1.8% inflation forecast implied by the Treasury market.
A TALE OF TWO LABOR TRENDS
Today’s weekly update on jobless claims shows another dip, which provides more evidence for thinking that the recession is over. But as we keep repeating, the technical end of the recession doesn’t look poised to offer a quick, robust recovery this time. The qualification draws support from the uptick in the latest continuing jobless claims report.
TWO EXTREMES, ONE ECONOMY
We’ve been writing for months that the recession appears close to a “technical” finale but that the recovery would be slow, sluggish and generally vulnerable for an unusually extended period of time. Two stories in the latest news cycle echo our long-running commentary. In fact, the pair of stories makes the point better than we could.
AUGUST’S RETAIL REBOUND
Today’s update on retail sales certainly lends more credence to the notion that the economy is stabilizing and perhaps even poised for modest growth. Indeed, the 2.7% rise in seasonally adjusted retail sales in August was the highest monthly increase since January 2006.
Even better, a closer reading of the report shows that gains were broad based–only furniture/home furnishing stores and building materials/garden equipment establishments posted lesser sales on the month, seasonally adjusted.
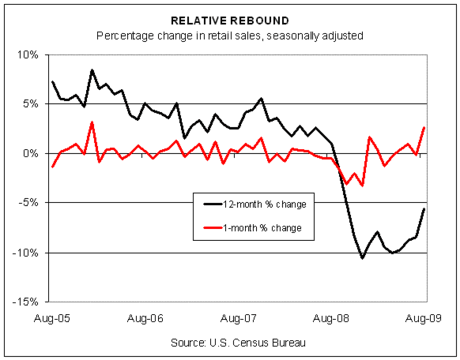
But we should be cautious in reading too much into the numbers. Keep in mind that motor vehicle sales lead consumption higher in August. The government’s cash-for-clunkers stimulus program was clearly a factor. But the auto phase of the government’s fiscal stimulus is history, at least for the moment.